Integration Catalog
- 16 Jan 2021
- 2 Minutes to read
- Contributors

- Print
- DarkLight
- Download PDF
Integration Catalog
- Updated on 16 Jan 2021
- 2 Minutes to read
- Contributors
- Print
- DarkLight
- Download PDF
Article summary
Did you find this summary helpful?
Thank you for your feedback!
If you do not already have an integration catalog then you might want to do something similar to what we did.
We chose to use Microsoft Lists as it means we could have the list accessible via a Microsoft Teams channel and we would also have the diagram embedded in the channel too as discussed in the deployment page. We added a couple of lists as described below.
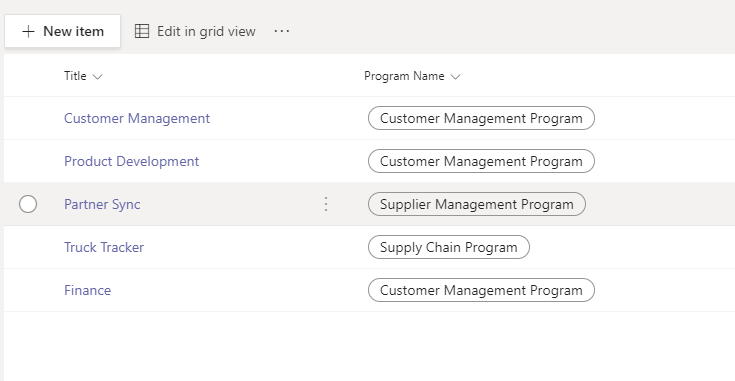
List of Projects & Programs
The list of programs and projects is a list which has as the title says a list of projects and a each project will be associated with a program if multiple projects are part of the same bigger piece.
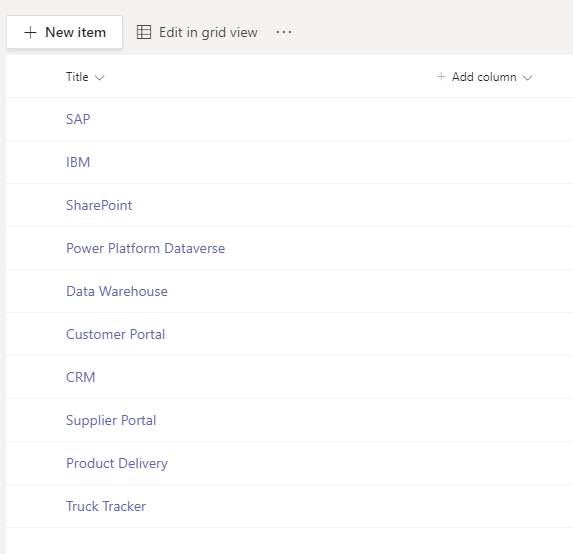
List of Systems
The list of systems is a very simple list which is the apps in the organisation.
List of System Integrations
The list of system integrations is a bit more complicated. You can see it below.
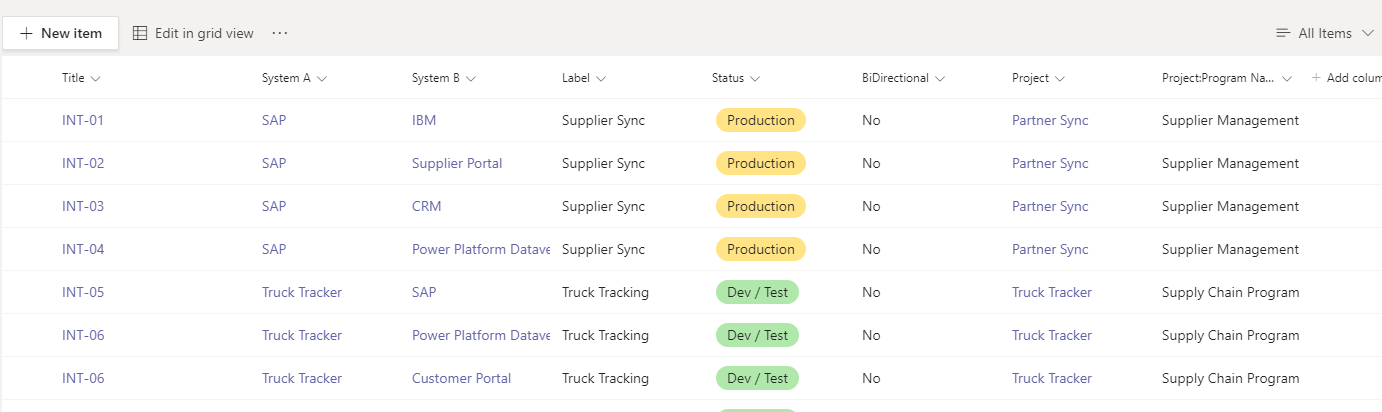
We now have a unique reference for each system integration, each one has a system A and system B which are lookup columns back to our systems list. We then have a label which is shown on the diagram and we have some columns which help support the filtering such as a status to let us see if its in production or not. There is also a lookup column to the project which delivered the integration.
Finally we have a bi-direction column which we have as true/false which is used to control the line on the diagram. We slightly abuse the use of the entity relationship diagram here so we use one way to mean that its a 1 to many and bi directional results in many to many. Obviously this isnt what its intended use is really for an entity relationship diagram but rather than inventing a new type of diagram this will help us to indicate if the integration pushes data one way or if there is data coming back too.
Points to Note
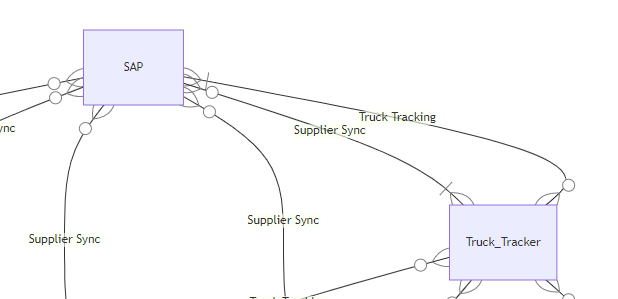
We know that there may be many interfaces delivered within an integration project and the aim of this diagram is not to be at specific interface level where the interface might be dealing with a specific type of data entity or process. We are looking to go one level down at a future point with a different type of diagram to represent this. At this point we are looking to communicate how there is a connection between 2 systems related to specific projects. There may be more than 1 connection between systems like shown below where SAP and Truck Tracker App talk to each other in a couple of different integration scenarios.
Was this article helpful?