App Insights with Logic Apps
- 31 May 2021
- 24 Minutes to read
- Contributors

- Print
- DarkLight
- Download PDF
App Insights with Logic Apps
- Updated on 31 May 2021
- 24 Minutes to read
- Contributors
- Print
- DarkLight
- Download PDF
Article summary
Did you find this summary helpful?
Thank you for your feedback!
If you are using Logic Apps Preview and running on a hosting plan like AKS or App Service then you have built in support for using App Insights with your Logic Apps. You dont really get this with the consumption model for logic apps because you are abstracted from the host so its not really possible to get the underlying telemetry.
If we stick to Logic Apps Preview in this post because you dont really have this option available with Logic Apps Consumption.
Target Users
App Insights in this scenario is really intended to target Logic App and Azure experts.
Target Use Cases
There will be lots of data captured by App Insights about your logic apps and you will need to have a good understanding of them to interpret the data into useful insights and actions.
With this data and an understanding of your logic app implementations you will be able to do lots of analysis across workflows and within workflows to understand the performance of your logic apps and to help see patterns in behaviour.
App Insights will be great to help you deep dive on problems, troubleshoot performance issues and to generally help build integration services which have a better quality of service for your users.
In the following sections we will look at some of the features of App Insights which get lit up when you are using Logic Apps and how you might use them.
Prerequisites
- An App Insights setup with Log Analytics Workspace type
- A logic app preview plan and some workflows on it
Note
You might not even need to connect App Insights to a Log Analytics workspace but that seems to be the recommendation for new app insights setups so I am only really looking at that option for now
My Implementation
In my implementation I am using Logic Apps preview and have implemented the same workflows that I did on the consumption plan for the other demos but I have used Logic Apps Standard instead. I have then setup my Logic App to be connected to an App Insights instance.
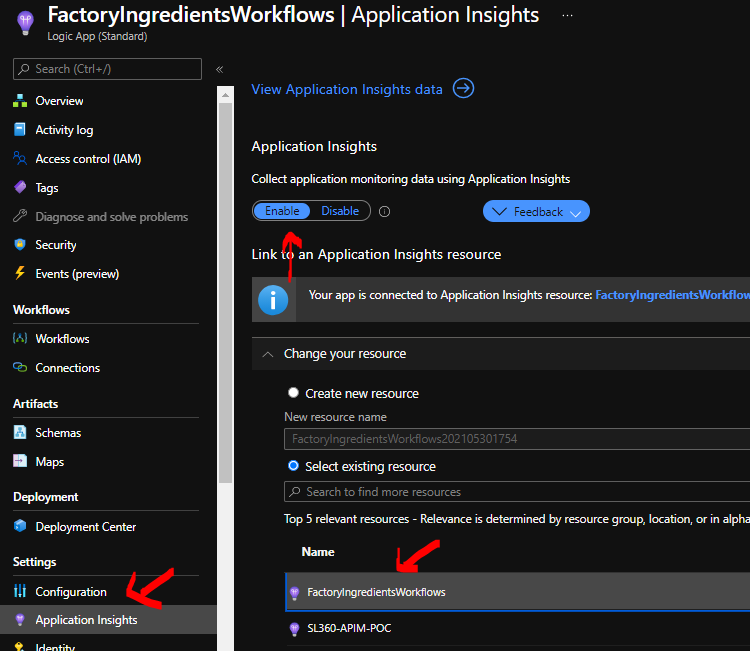
There is nothing app insights specific about any of the workflows. The only thing I did was add tracked properties like I did in the first log analytics demo.
Next we will look at some of the features of App Insights that we can use when running the demos.
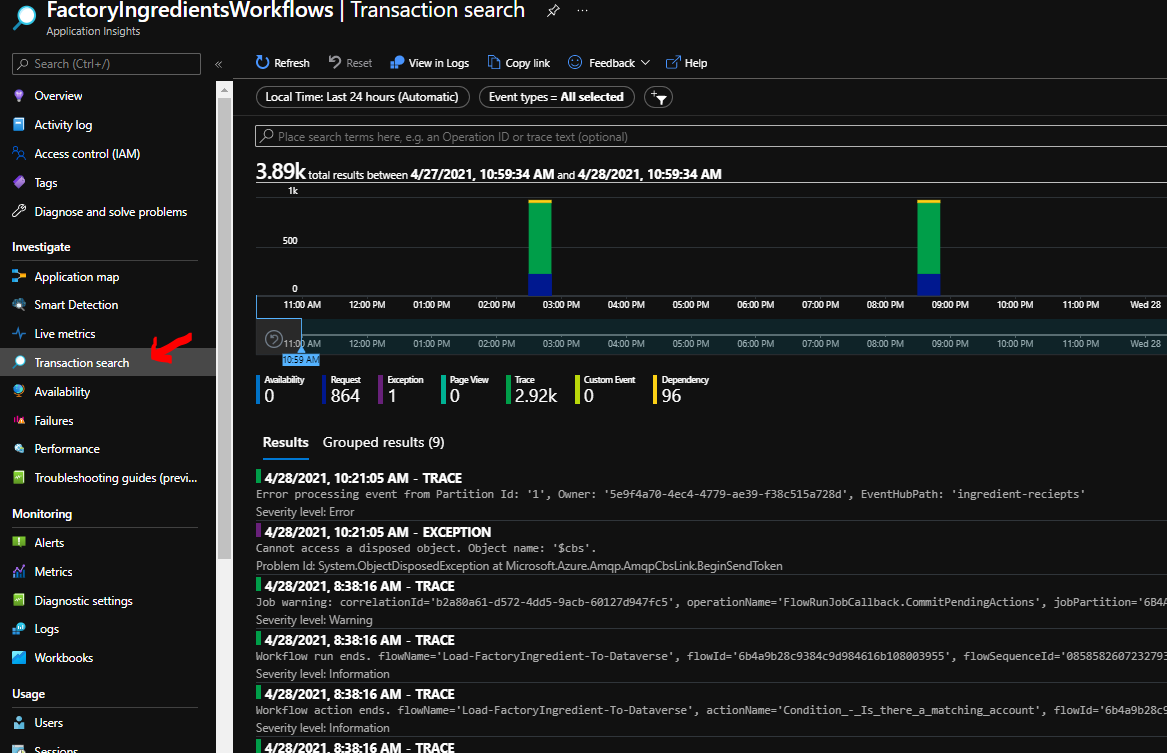
Transaction Search
One of the good features in app insights is that I can use the transaction search to help look for telemetry events. You can see below that by default I see a list of some events and there is a search bar where I can do a fuzzy search.
Requests
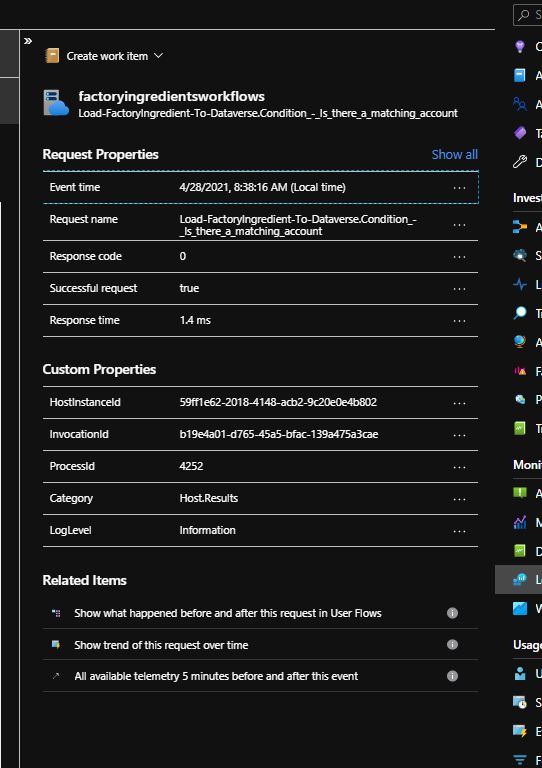
The request telemetry events are written to the request log under the hood and there is 1 event for the start and end of the workflow and each action within it. I can see these events in the transaction search and can click and open them up where I would see properties about the request event like shown below.
The request telemetry is also releated automatically by app insights. This is really cool and lets me see a timeline style view of my request and the events in the flow before and after my event which are related to me workflow instance. This can be very helpful in troubleshooting how your workflows are running.
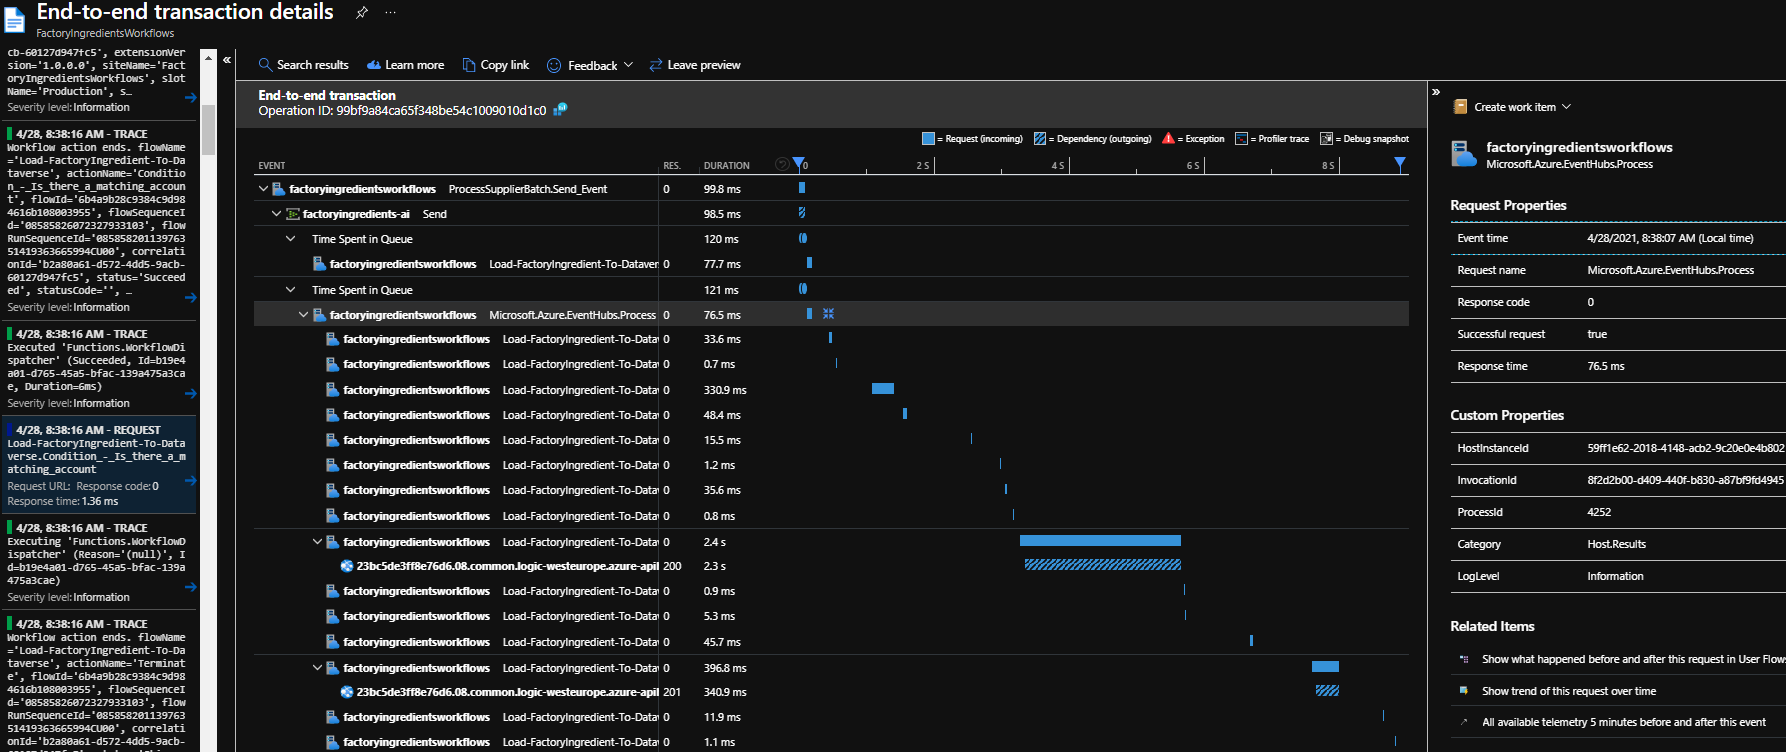
I will dig more into the request log later.
Traces
The workflow runtime is also writing trace events as it executes. These are written to the traces log under the hood (which we will look at in more detail later).
In the transaction search I can click on a trace event and it will open up like the requests do, but it will also show me a lot more properties specific to the workflow and action. My interpretation of the data we see is that the logic app workflow runtime is recording request and trace telemetry for each workflow run and action execution. It also looks to be writing some internal trace events too. There is quite a bit in the traces but there is some really useful data here.
Below is what a typical trace event looks like in the transaction search.
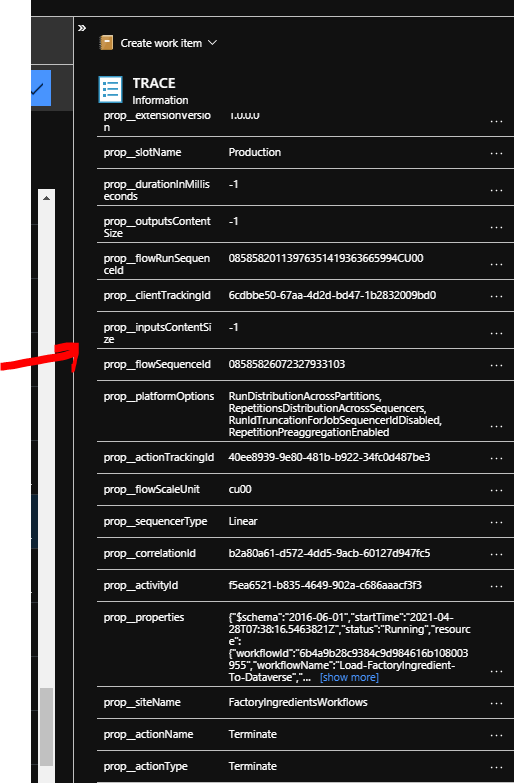
You will also be able to see your tracked properties on a trace too which we will look at later.
Application Map
App Insights has an application map feature. Its pretty cool, especially for custom apps. It can be used with Logic Apps too and you can see below is the diagram for my demo.
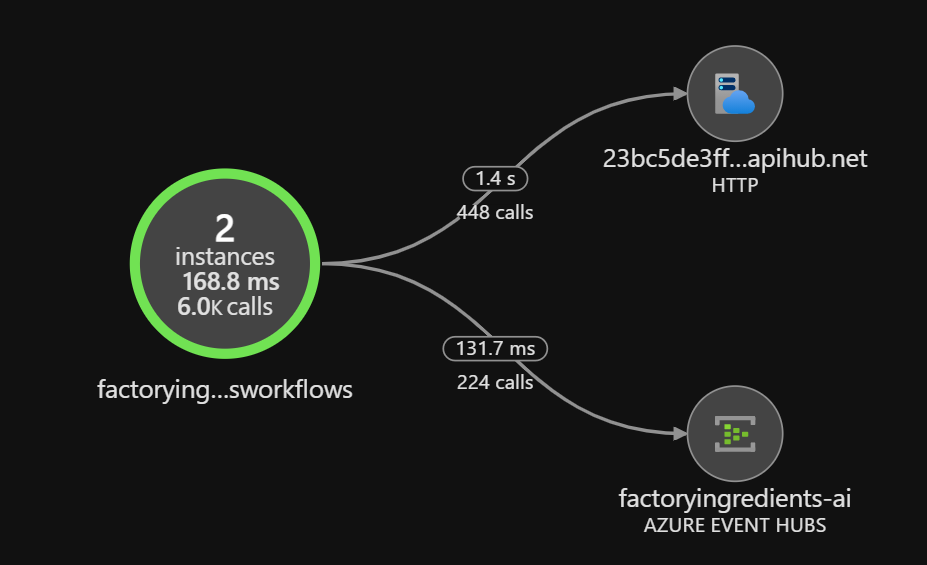
The application map has a limitation in that it sees most of the calls that use the Azure API Hub (azure connectors) all as the same endpoint so it will limit how useful this feature is. Most of your calls seem to go to the same endpoint even though the API hub will route them to different places downstream.
Later in this article ill be looking at how you can mine the dependencies log to be able to get more detail about your dependencies.
The App Insights Logs
In this section we will look at the detail of whats in some of the logs and how you might be able to use it. First off though there are a few logs which dont seem to have anything that useful in them.
The following logs dont seem to be used
- customEvents
- pageViews
The following logs seem to be used for internal stuff for the runtime but I havent seen anything specific to my workflows.
- exceptions
Requests
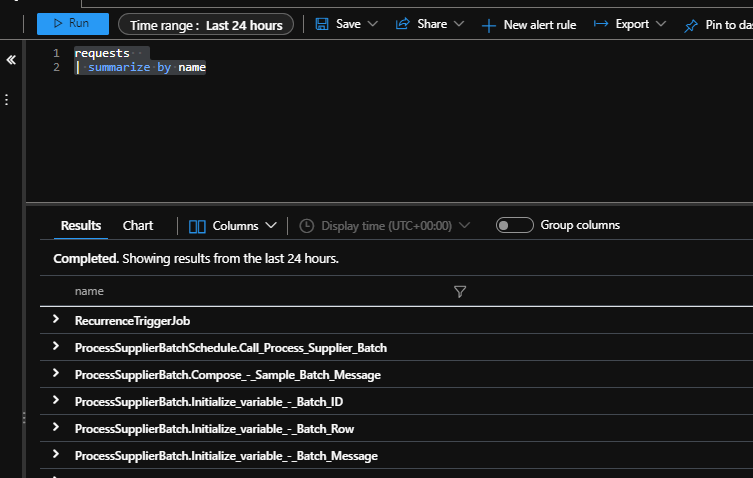
I mentioned requests earlier in addition to the requests in the transaction search you can also query the request logs directly. One thing you can do to get a flavour of what is in the log is run the below query which will show you all of the different types of request events.
requests
| summarize by name
You will see in the response that the requests relate to each action and workflow.
You end up with 1 request logged per workflow and 1 for each workflow action. This is quite a few messages. The requests are a bit harder to accurately query because the data in the log entry doesnt have explicit fields for the workflow and action but you can parse the operation name and split it to work these out. The operation names are in the following format:
- Workflow = [Workflow Name]
- Action = [WorkflowName].[ActionName]
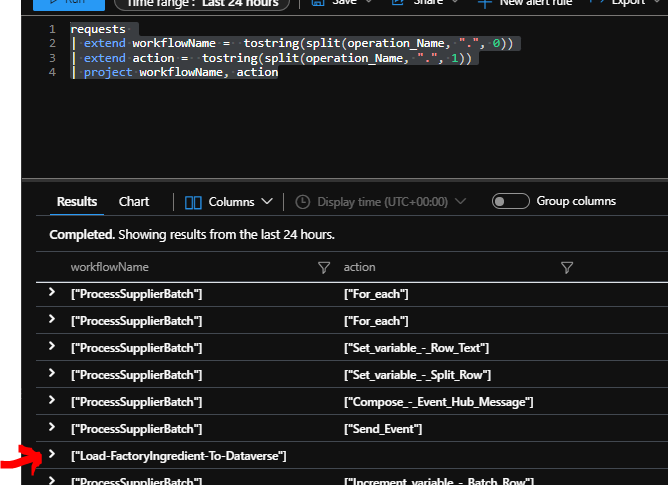
The below query will help you easily see what I mean here
requests
| extend workflowName =  tostring(split(operation_Name, ".", 0))
| extend action =  tostring(split(operation_Name, ".", 1))
| project workflowName, action
If you notice the row I highlighted is the workflow and the others are for actions
One thing I think will be challenging in the real world is that you could have 2 logic apps which both had workflows with the same name in them. I cant see how in the request log you could differentiate between which workflow a log entry came from (you might be able to use the cloud role name property but id have to investigate that further). Note you can do more in the traces log which we will look at later.
I think the thing you are most likely to be trying to do in the requests log is look for patterns of usage and performance.
If we are wanting to just look at the requests for performance and patterns then this query will simplify the view a bit.
requests
| extend workflowName =  tostring(split(operation_Name, ".", 0))
| extend action =  tostring(split(operation_Name, ".", 1))
| project workflowName, action, performanceBucket, duration, resultCode, success
Long running actions
If we wanted to start by investigating long running actions we could start with this query which would give us a list of actions which took over 3 seconds
requests
| extend workflowName =  tostring(split(operation_Name, ".", 0))
| extend action =  tostring(split(operation_Name, ".", 1))
| project workflowName, action, performanceBucket, duration, resultCode, success
| where duration > 3000
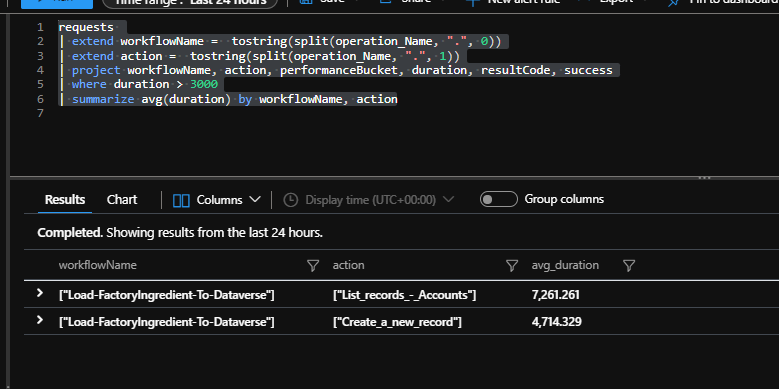
Next we might want to summarize the data so we can see which workflows and actions are problematic. The below query will help
requests
| extend workflowName =  tostring(split(operation_Name, ".", 0))
| extend action =  tostring(split(operation_Name, ".", 1))
| project workflowName, action, performanceBucket, duration, resultCode, success
| where duration > 3000
| summarize avg(duration) by workflowName, action
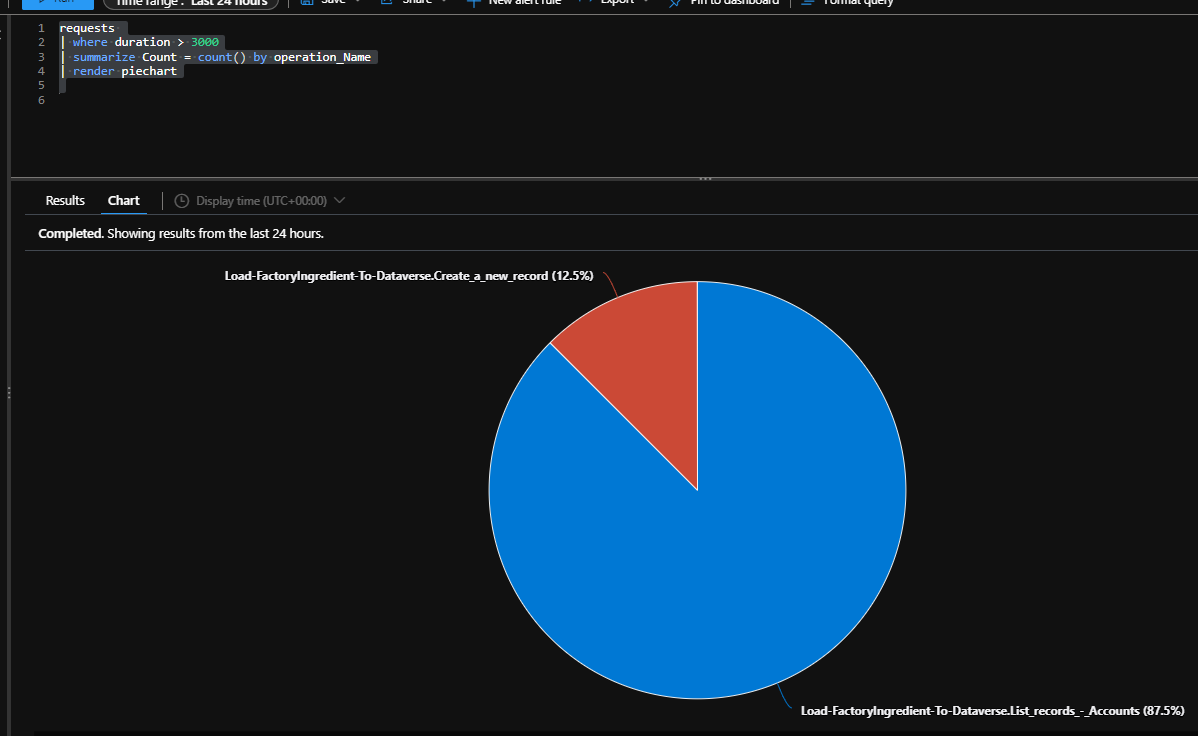
Next we might want to investigate the breakdown of which actions in which workflows are taking the most time. We could use the below chart to see which ones are taking over our threshold of 3 seconds.
requests
| where duration > 3000
| summarize Count = count() by operation_Name
| render piechart
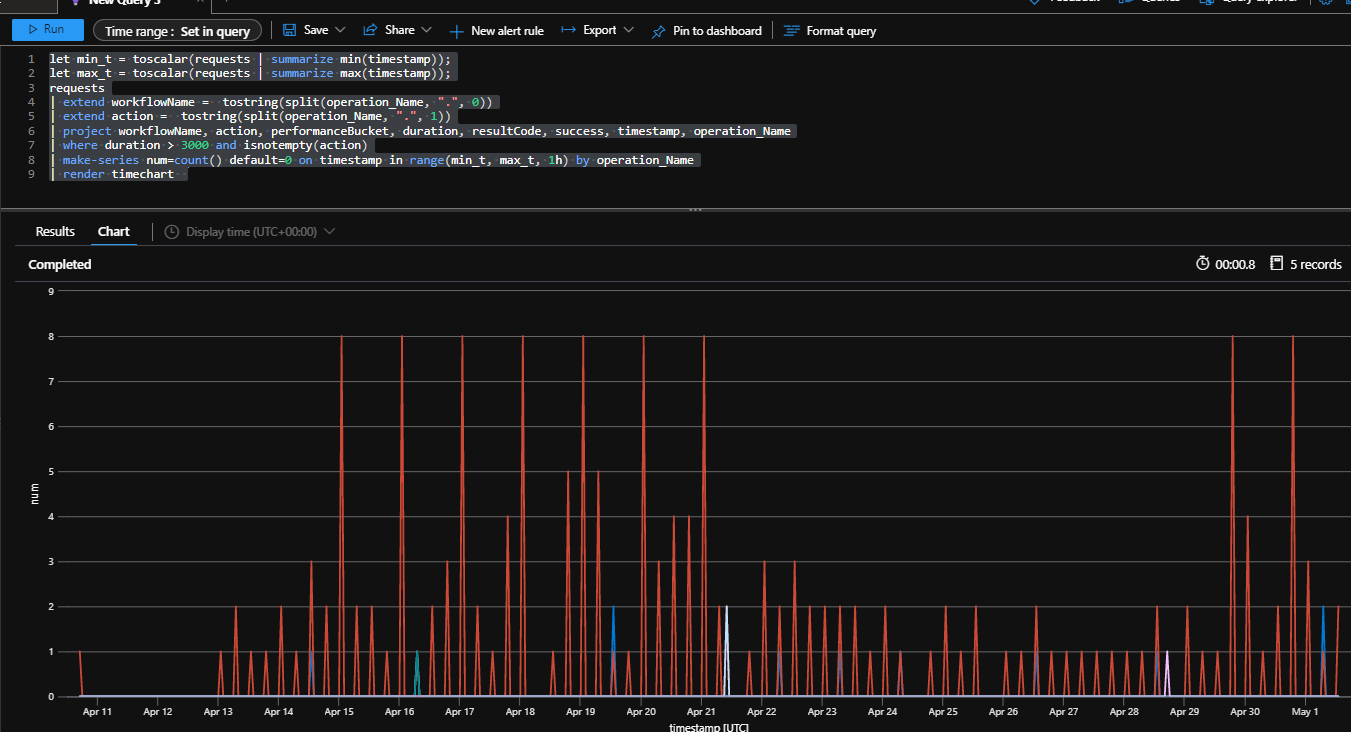
Next id like to see the profile of when my longer running actions are happening. I can use the below query which will create my simpler view of the data for actions taking over 3 secs and I can display it as a timechart so I can see when things are happening. In this case summarized by the hour.
let min_t = toscalar(requests | summarize min(timestamp));
let max_t = toscalar(requests | summarize max(timestamp));
requests
| extend workflowName =  tostring(split(operation_Name, ".", 0))
| extend action =  tostring(split(operation_Name, ".", 1))
| project workflowName, action, performanceBucket, duration, resultCode, success, timestamp, operation_Name
| where duration > 3000 and isnotempty(action)
| make-series num=count() default=0 on timestamp in range(min_t, max_t, 1h) by operation_Name
| render timechart
Errors
I think the requests log is not the best place to go mining for info about errors. It looks to me like the data in there doesnt really capture error info or indicate which actions failed. We can do more with this in the trace log which we will look at next.
Traces
If you take a look at the traces log the first thing you will notice is that you have a combination of trace messages from your workflows and also from the workflow runtime so you will need to filter these out. Below is an initial view
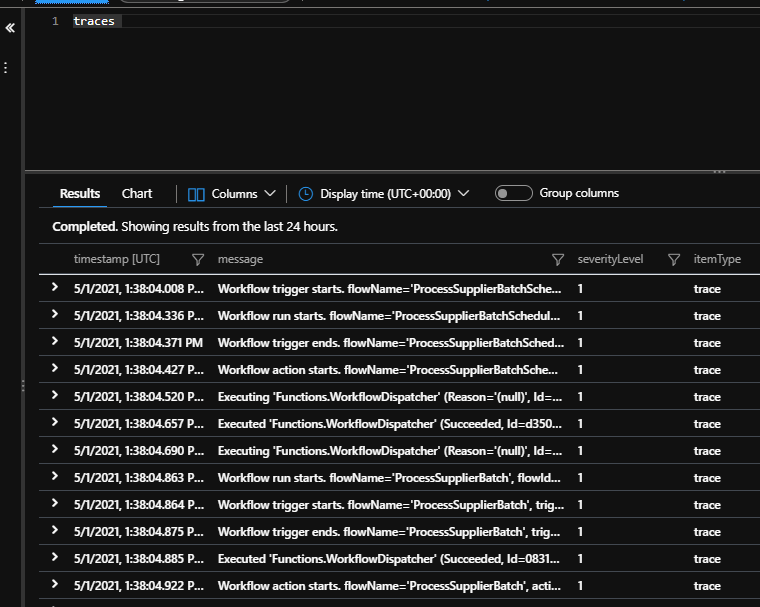
I think most of the properties you will be interested in for Logic Apps will be inside the customDimensions property within the log entry as shown below.
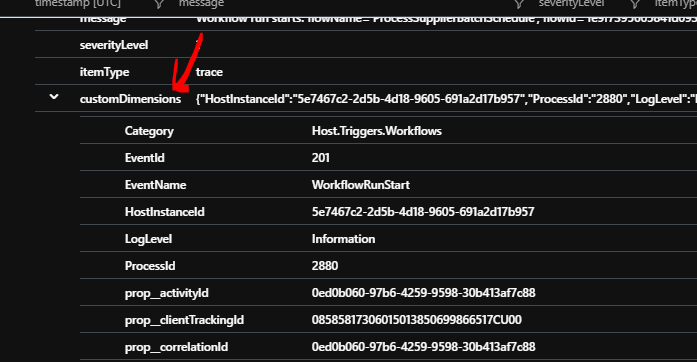
We can use the extend feature in kusto to dig into this customDimensions to do our queries.
What trace events do we have?
To start looking at the log we need to take a look at what events we are getting from Logic Apps. Run the below query and it will list the event types:
traces
| extend EventName_ = tostring(customDimensions.EventName)
| summarize by EventName_
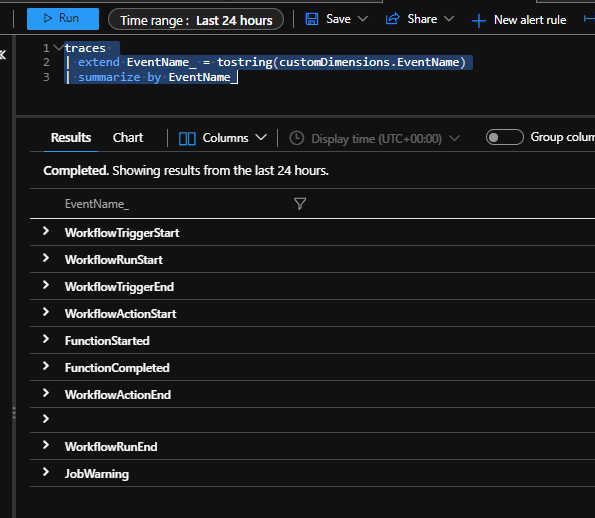
As you can see in the above table we will have some events for start and end for triggers, workflows and actions and also some events for the runtime. There is a lot of good stuff we can do with the trace events like I will show below.
List the Workflows in each Logic App which have had events
This could help you check which of your logic apps are actually running and look for workflows you might want to get rid of.
traces
| extend EventName_ = tostring(customDimensions.EventName)
| extend logicApp_WorkflowId = tostring(customDimensions.prop__flowId)
| extend logicApp_RunId_ = tostring(parse_json(tostring(parse_json(tostring(customDimensions.prop__properties)).resource)).runId)
| extend logicApp_WorkflowName_ = tostring(parse_json(tostring(parse_json(tostring(customDimensions.prop__properties)).resource)).workflowName)
| extend logicApp_AppName = tostring(customDimensions.prop__siteName)
| where isnotempty(logicApp_WorkflowName_)
| summarize count() by logicApp_AppName, logicApp_WorkflowName_
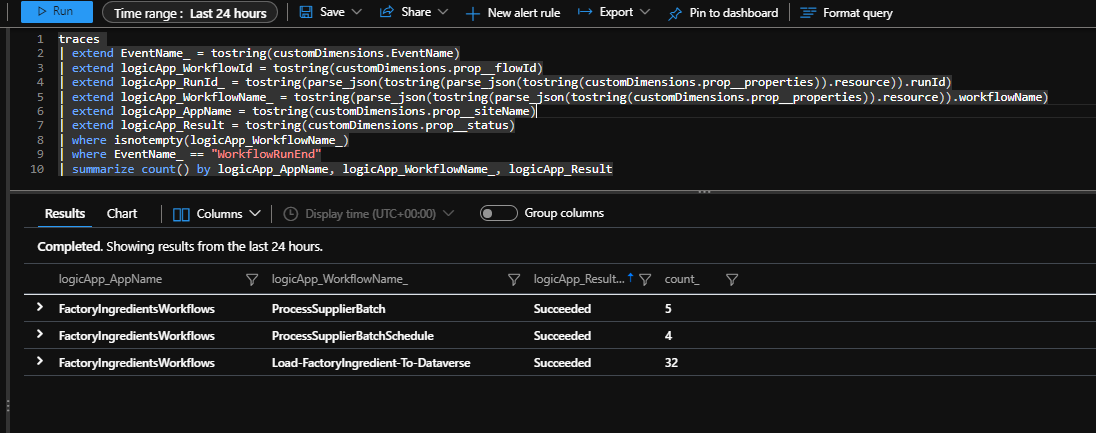
List the Workflows by Result
This will let you see a table of the workflow runs and how they completed.
traces
| extend EventName_ = tostring(customDimensions.EventName)
| extend logicApp_WorkflowId = tostring(customDimensions.prop__flowId)
| extend logicApp_RunId_ = tostring(parse_json(tostring(parse_json(tostring(customDimensions.prop__properties)).resource)).runId)
| extend logicApp_WorkflowName_ = tostring(parse_json(tostring(parse_json(tostring(customDimensions.prop__properties)).resource)).workflowName)
| extend logicApp_AppName = tostring(customDimensions.prop__siteName)
| extend logicApp_Result = tostring(customDimensions.prop__status)
| where isnotempty(logicApp_WorkflowName_)
| where EventName_ == "WorkflowRunEnd"
| summarize count() by logicApp_AppName, logicApp_WorkflowName_, logicApp_Result
Profile the workflows that have had errors
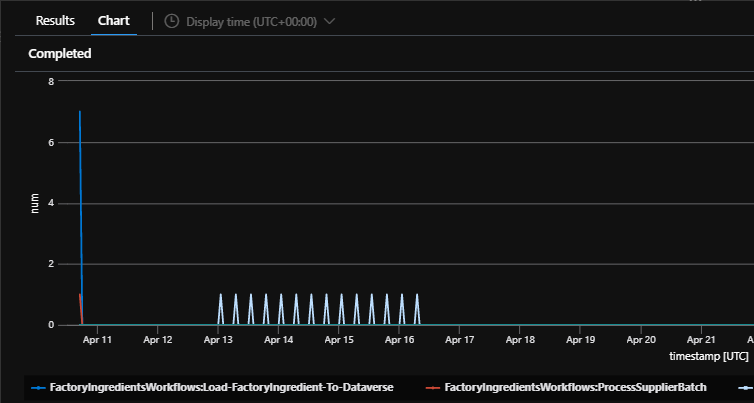
This query will get the workflow runs that have had errors and then show me when they have happened for each of the workflows. I can also modify the result filter to get the profile for succeeded logic apps too.
let min_t = toscalar(requests | summarize min(timestamp));
let max_t = toscalar(requests | summarize max(timestamp));
traces
| extend EventName_ = tostring(customDimensions.EventName)
| extend logicApp_WorkflowId = tostring(customDimensions.prop__flowId)
| extend logicApp_RunId_ = tostring(parse_json(tostring(parse_json(tostring(customDimensions.prop__properties)).resource)).runId)
| extend logicApp_WorkflowName_ = tostring(parse_json(tostring(parse_json(tostring(customDimensions.prop__properties)).resource)).workflowName)
| extend logicApp_AppName = tostring(customDimensions.prop__siteName)
| extend logicApp_Result = tostring(customDimensions.prop__status)
| where isnotempty(logicApp_WorkflowName_)
| where EventName_ == "WorkflowRunEnd"
and logicApp_Result == "Failed"
| make-series num=count() default=0 on timestamp in range(min_t, max_t, 1h) by strcat(logicApp_AppName, ":", logicApp_WorkflowName_)
| render timechart
List the actions in by workflow and result
The below query will give you a table summarizing the number of each action executed by result. This table could be useful to help mine this data further if you want to create visuals for specific logic apps.
traces
| extend EventName_ = tostring(customDimensions.EventName)
| extend logicApp_WorkflowId = tostring(customDimensions.prop__flowId)
| extend logicApp_RunId_ = tostring(parse_json(tostring(parse_json(tostring(customDimensions.prop__properties)).resource)).runId)
| extend logicApp_WorkflowName_ = tostring(parse_json(tostring(parse_json(tostring(customDimensions.prop__properties)).resource)).workflowName)
| extend logicApp_AppName = tostring(customDimensions.prop__siteName)
| extend logicApp_ActionResult = tostring(customDimensions.prop__status)
| extend logicApp_ActionName = operation_Name
| where isnotempty(logicApp_WorkflowName_) and EventName_ == "WorkflowActionEnd"
| summarize count() by logicApp_AppName, logicApp_WorkflowName_, logicApp_ActionName, logicApp_ActionResult
As you can see there it loads of opportunity to do good things with the info in the trace log and hopefully these few queries give you some inspiration on how to use it. Ill be talking a little more later about tracked properties within the trace log so keep an eye out for that section in this article.
Performance Counters
This log looks like it gets all of the performance counter data related to the app service plan. It will probably be used for the metrics that we see in the Azure portal for typical app service plan performance scenarios. The below picture shows a simple query of this data and you can mine this if you want to but it looks like generic stuff related to the app service plan so for the purposes of this article I am going to focus on other areas. There is plenty of content online about performance tuning and monitoring of app service plans.
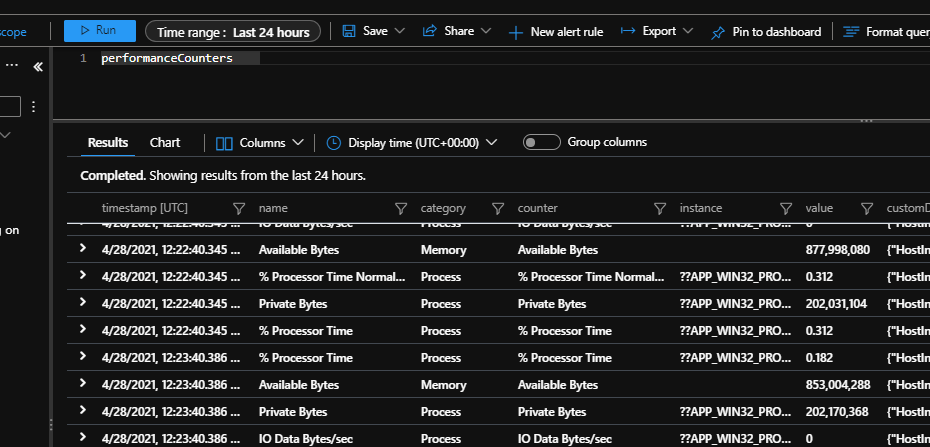
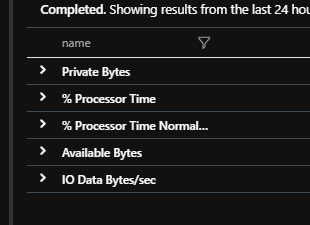
What counters do I have
The below query shows the list of counters I have available.
performanceCounters
| summarize by name
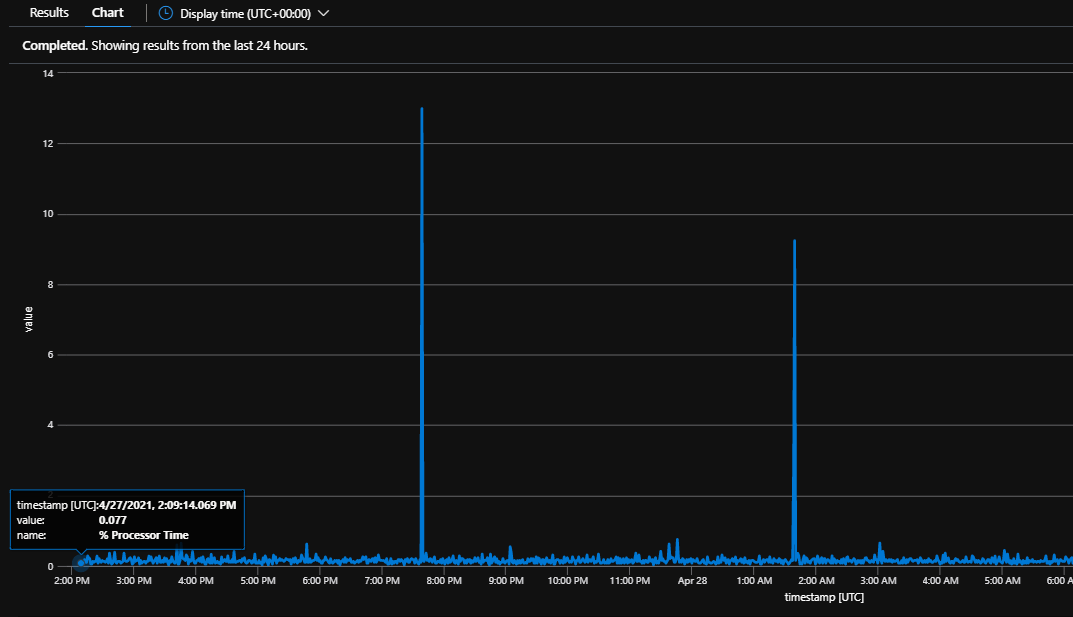
Query performance counter time chart
The below query will let you query the CPU usage of your app service plan over time. You can render this as a chart.
performanceCounters
| where name endswith_cs "% Processor Time"
| project timestamp, value, name
| render timechart
Dependencies
The dependencies log is used in a way that logic apps inherits from using app insights and an app service plan. There are a couple of caveats with dependancies isnt 100% perfect. The main ones ive seen are:
- It doesnt seem to include the inbound triggers so its more what the workflow uses
- For logic apps, many of your dependancies will be the API Hub on Azure so you will get a url which will have additional information about the service it forwards on to. Many of your dependancy types are going to be HTTP
- There is a little inconsistency between the target and name properties for the downstream service your consuming based on if the connector is an azure connector (API Hub) or an inline connector
You can query the dependencies log to do some stuff like the following:
List my dependencies in a workflow
The below query would list the dependancies you have in a given workflow.
dependencies
| extend workflowName =  tostring(split(operation_Name, ".", 0))
| project ['type'], name, target, workflowName
| summarize count() by ['type'], name,  target, workflowName
List my dependencies by workflow and action
The below query would give you a list of your dependencies by type and address and which workflow/action they are used in
dependencies
| extend workflowName =  tostring(split(operation_Name, ".", 0))
| extend action =  tostring(split(operation_Name, ".", 1))
| project ['type'], name, target, workflowName, action
| summarize count() by ['type'], name, target, workflowName, action
Dependency Use Chart
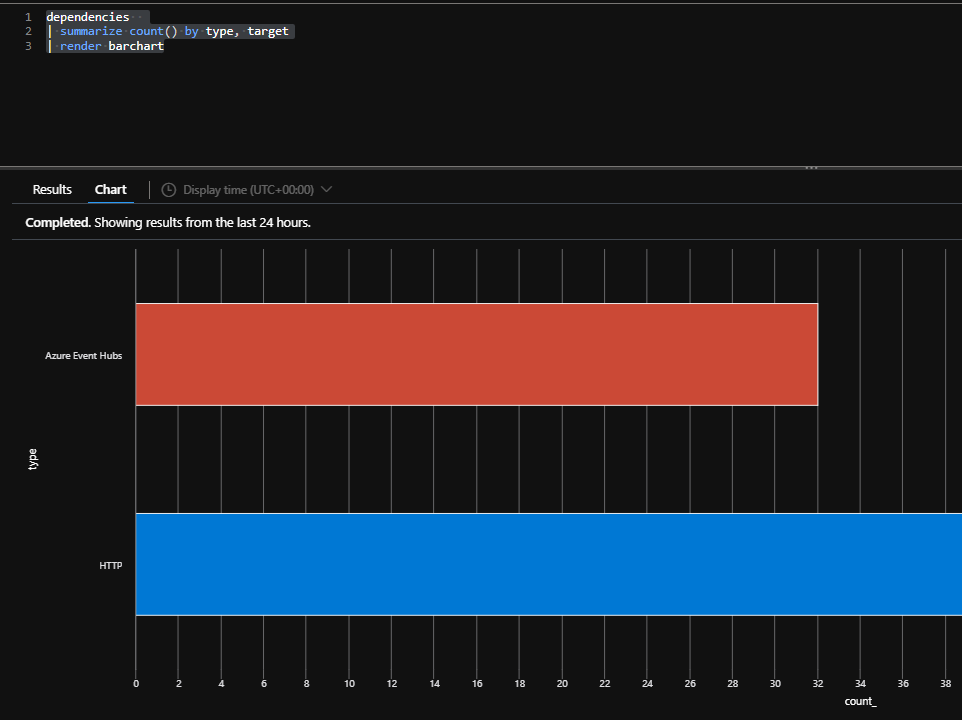
You could get a graph of the dependencies used in your workflows using the below query.
dependencies
| summarize count() by type, target
| render barchart
This would give you a graph like below:
Long Running Dependencies
The below query will allow you to look for long running dependencies and which workflow and action they were called by. This would be good to use when looking across your logic apps to see performance bottlenecks and where slow services are consumed.
dependencies
| extend workflowName =  tostring(split(operation_Name, ".", 0))
| extend action =  tostring(split(operation_Name, ".", 1))
| project duration, ['type'], name, target, workflowName, action
| where duration > 1000
Custom Metrics
The custom metrics log is where logic apps is recording the custom counters specific to logic apps. You can see the counters available with the below query
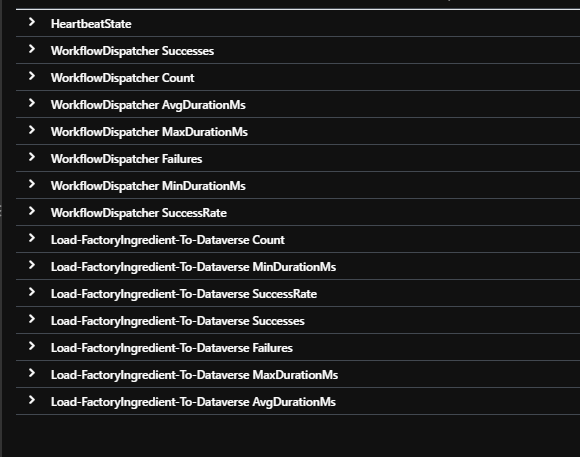
customMetrics
| summarize by name
This will give you a view like below.
Get Latest Metrics
It looks like the metrics get updated each time workflows run I am guessing but one thing you could do is run a query to summarize the metrics over a time period for a given workflow.
Below is an example where I am summarizing the metrics for my load to dataverse workflow for the period in the query explorer and ill get an average value for each country as you can see below.
customMetrics
| where name startswith "Load-FactoryIngredient-To-Dataverse "
| summarize avg(valueCount), avg(valueMax), avg(valueMin) by name
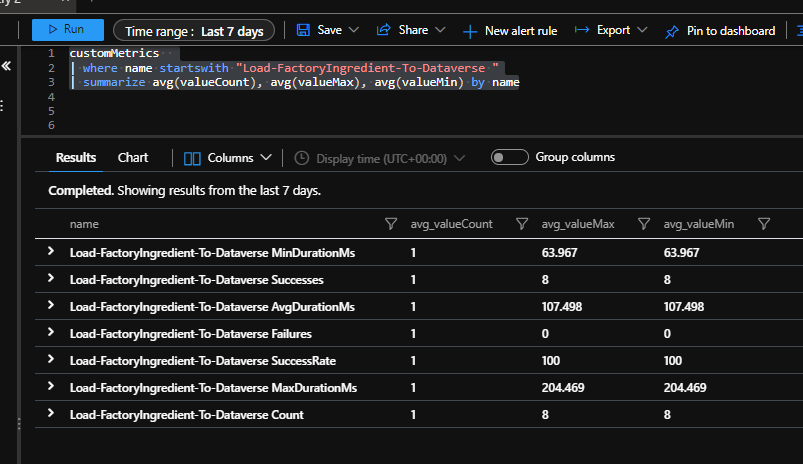
One thing to note is that it seems like the counter names would need to be queried with the name of the workflow and a space before the counter name. I am not sure if this might give you an issue if you have multiple workflows in different logic apps which share the same name but live on the same app service plan so would share the same app insights instance.
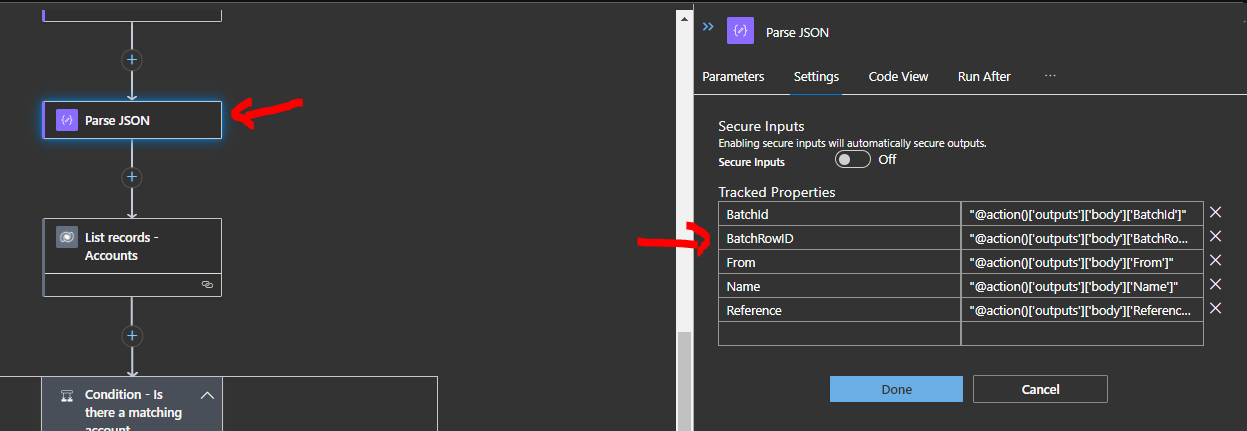
Tracked Properties
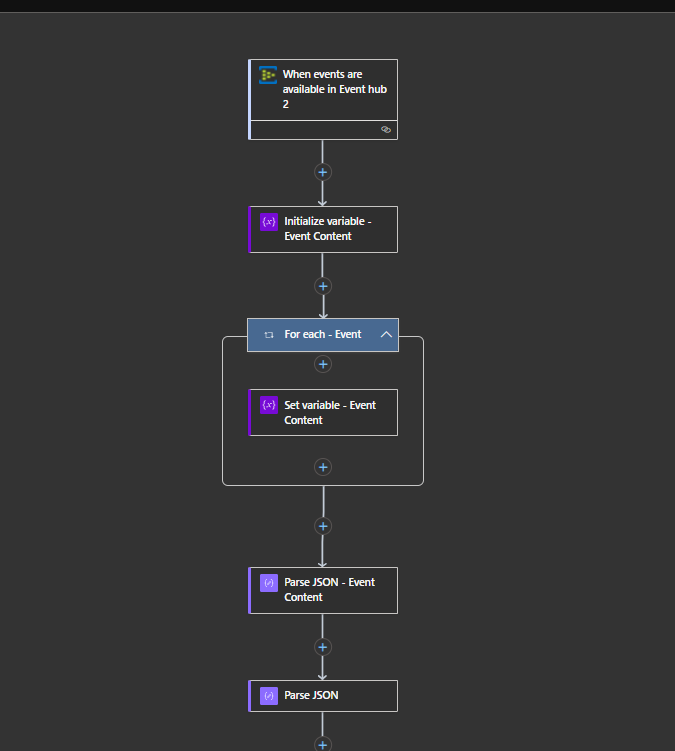
If we are using the tracked properties feature in our logic apps then we can see these in app insights. You can see below in my workflow I have configured some tracked properties in the parse json action. This will allow some custom info to be included in the app insights tracking.
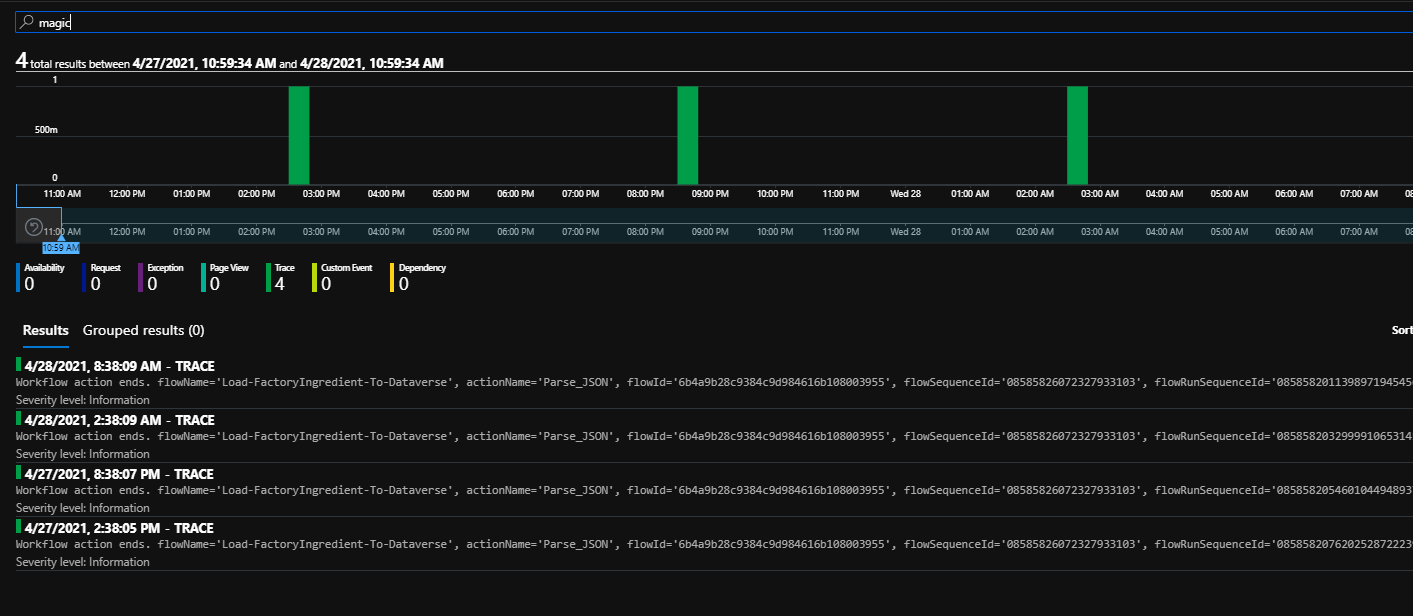
Next if I go to the transaction search in app insights I can now query based on the data in those properties I tracked. You can see in the search below I just put the word magic in the search and it will perform a fuzzy search of my app insights telemetry and it found 4 messages in the 24 hour period which contained magic.
If I click on the trace item that was returned in the search you can see that it includes a bunch of information about the trace message from the workflow which happens automatically for each shape. This included my tracked properties and I can see in the prop__properties field on the trace item that I have my tracked properties.
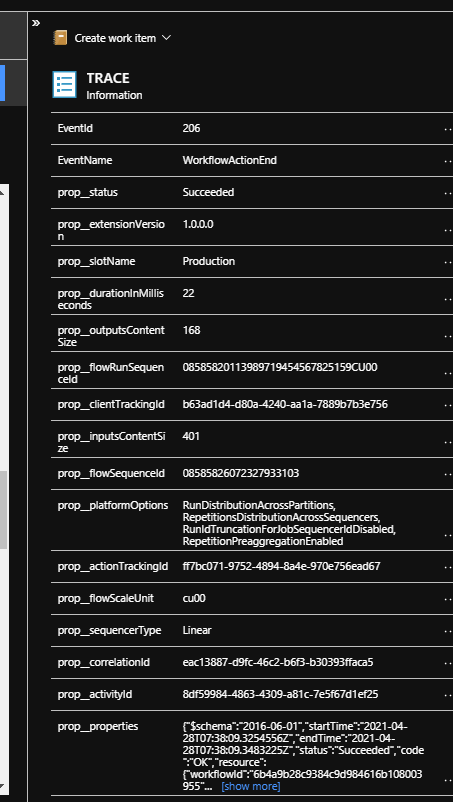
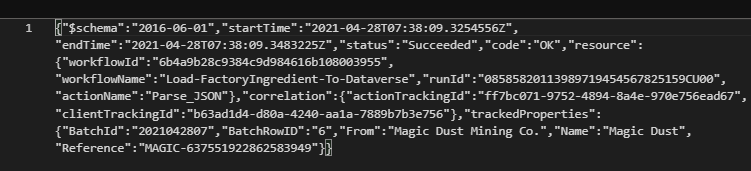
You can open them out and you would see the json representing my properties below.
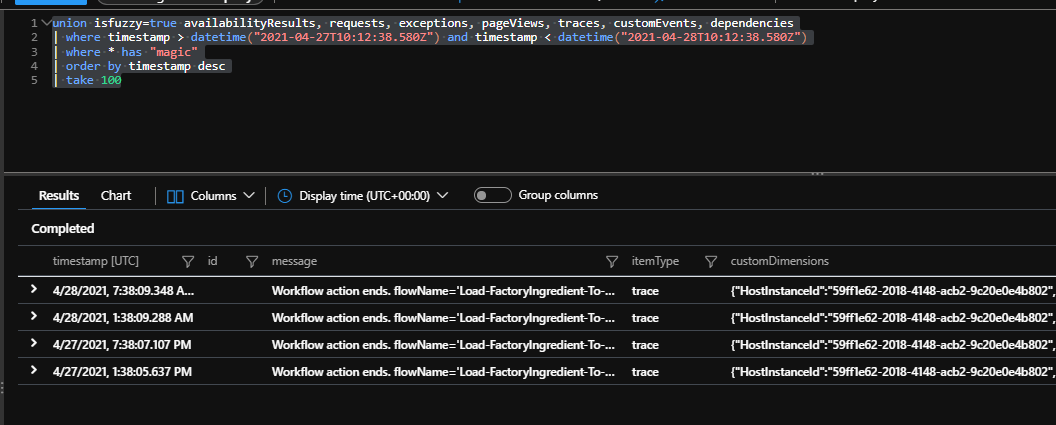
Back on the Transaction Search screen there is also a view in logs like which would open the query screen and you can see the query that the transaction search used to find my items that matched "magic". This query would be:
union isfuzzy=true availabilityResults, requests, exceptions, pageViews, traces, customEvents, dependencies
| where timestamp > datetime("2021-04-27T10:12:38.580Z") and timestamp < datetime("2021-04-28T10:12:38.580Z")
| where * has "magic"
| order by timestamp desc
| take 100
You can see this is doing a fuzzy search across all of the different app insights logs for items that match. Running it directly in the logs shows the data below.
Now that we know where custom properties are in the logs lets see if we can do some queries on the trace logs to do some useful things with them.
Find log entries with tracked properties on them
The below query will give you a good base query to find workflow actions which have tracked properties on them so you can dig further into doing more with it.
traces
| extend EventName_ = tostring(customDimensions.EventName)
| where EventName_ == "WorkflowActionEnd"
| extend workflowActionName = tostring(customDimensions.prop__actionName)
| extend workflowActionType = tostring(customDimensions.prop__actionType)
| extend workflowRunId = tostring(customDimensions.prop__flowRunSequenceId)
| extend workflowName = tostring(parse_json(tostring(parse_json(tostring(customDimensions.prop__properties)).resource)).workflowName)
| extend workflowActionStatus = tostring(customDimensions.prop__status)
| extend logicAppSiteName = tostring(customDimensions.prop__siteName)
| extend actionDuration = tostring(customDimensions.prop__durationInMilliseconds)
| extend trackedProperties = tostring(parse_json(tostring(customDimensions.prop__properties)).trackedProperties)
| where isnotempty(trackedProperties)
| project logicAppSiteName, workflowName, workflowRunId, workflowActionType, workflowActionName, workflowActionStatus, actionDuration, trackedProperties
Find log entries which by a given property
Now that I can access the properties lets go back to my demo. I want to find which logic apps acted on batch 2021043019. I can use the below query to find a list of log entries.
traces
| extend EventName_ = tostring(customDimensions.EventName)
| where EventName_ == "WorkflowActionEnd"
| extend workflowActionName = tostring(customDimensions.prop__actionName)
| extend workflowActionType = tostring(customDimensions.prop__actionType)
| extend workflowRunId = tostring(customDimensions.prop__flowRunSequenceId)
| extend workflowName = tostring(parse_json(tostring(parse_json(tostring(customDimensions.prop__properties)).resource)).workflowName)
| extend workflowActionStatus = tostring(customDimensions.prop__status)
| extend logicAppSiteName = tostring(customDimensions.prop__siteName)
| extend actionDuration = tostring(customDimensions.prop__durationInMilliseconds)
| extend trackedProperties = tostring(parse_json(tostring(customDimensions.prop__properties)).trackedProperties)
| where isnotempty(trackedProperties)
| project logicAppSiteName, workflowName, workflowRunId, workflowActionType, workflowActionName, workflowActionStatus, actionDuration, trackedProperties
| where parse_json(trackedProperties).BatchId == 2021043019
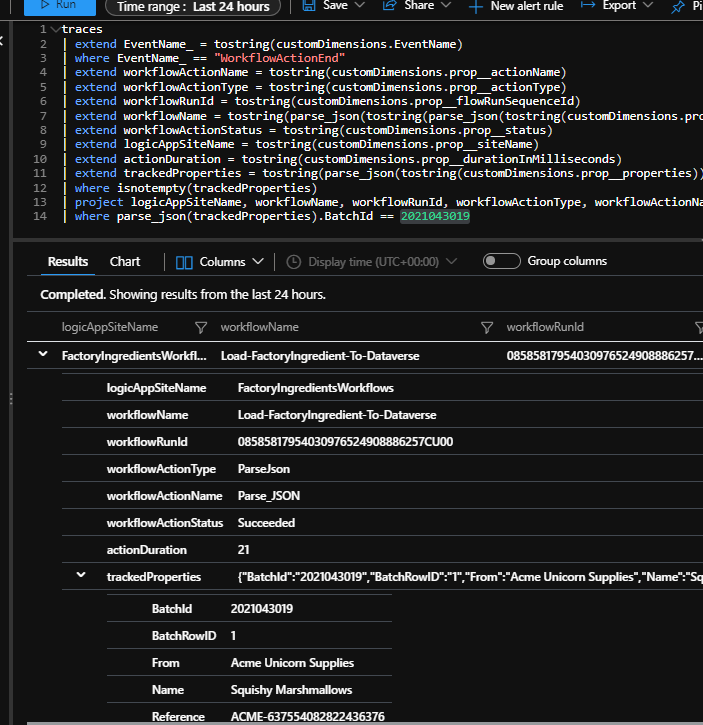
This gives me a great way to use this info to find various things out about my workflows based on tracked properties from my logic apps.
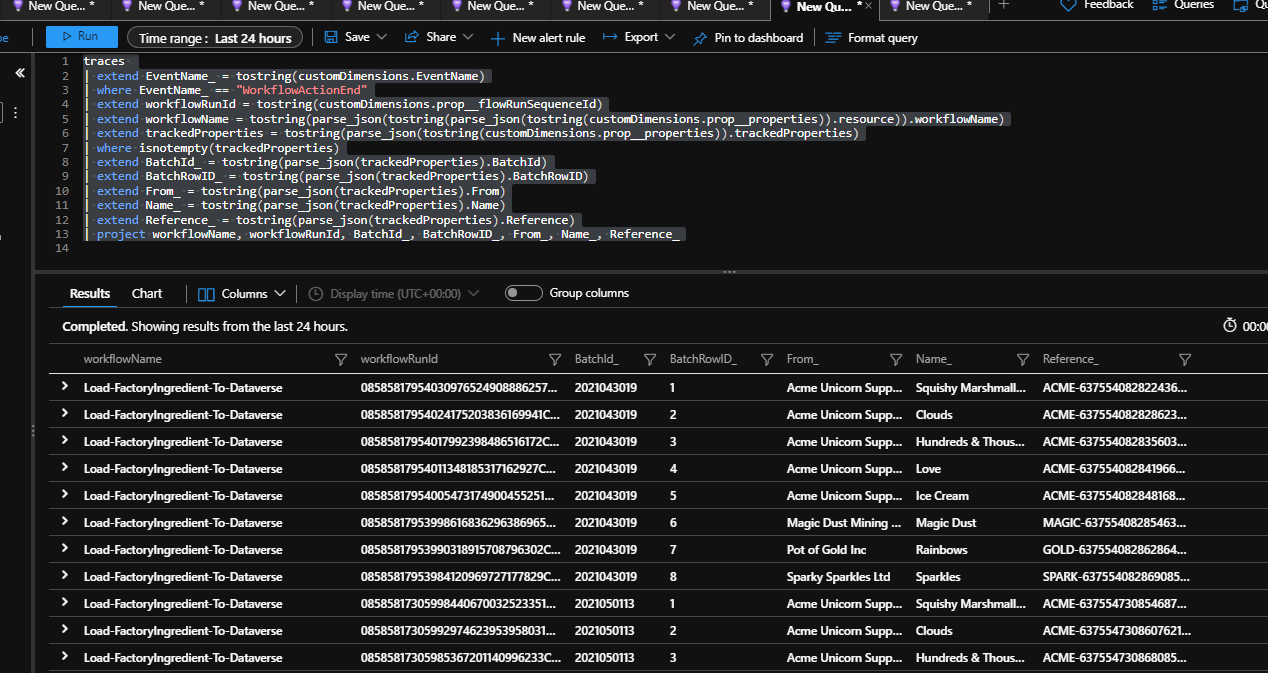
Show me a view based on my logic app properties
In this case I can now do a query which shows which workflow processed which message in a much friendlier way by flattening the tracked properties and showing them in the view so I get a nice table of my batch id, product, etc.
traces
| extend EventName_ = tostring(customDimensions.EventName)
| where EventName_ == "WorkflowActionEnd"
| extend workflowRunId = tostring(customDimensions.prop__flowRunSequenceId)
| extend workflowName = tostring(parse_json(tostring(parse_json(tostring(customDimensions.prop__properties)).resource)).workflowName)
| extend trackedProperties = tostring(parse_json(tostring(customDimensions.prop__properties)).trackedProperties)
| where isnotempty(trackedProperties)
| extend BatchId_ = tostring(parse_json(trackedProperties).BatchId)
| extend BatchRowID_ = tostring(parse_json(trackedProperties).BatchRowID)
| extend From_ = tostring(parse_json(trackedProperties).From)
| extend Name_ = tostring(parse_json(trackedProperties).Name)
| extend Reference_ = tostring(parse_json(trackedProperties).Reference)
| project workflowName, workflowRunId, BatchId_, BatchRowID_, From_, Name_, Reference_
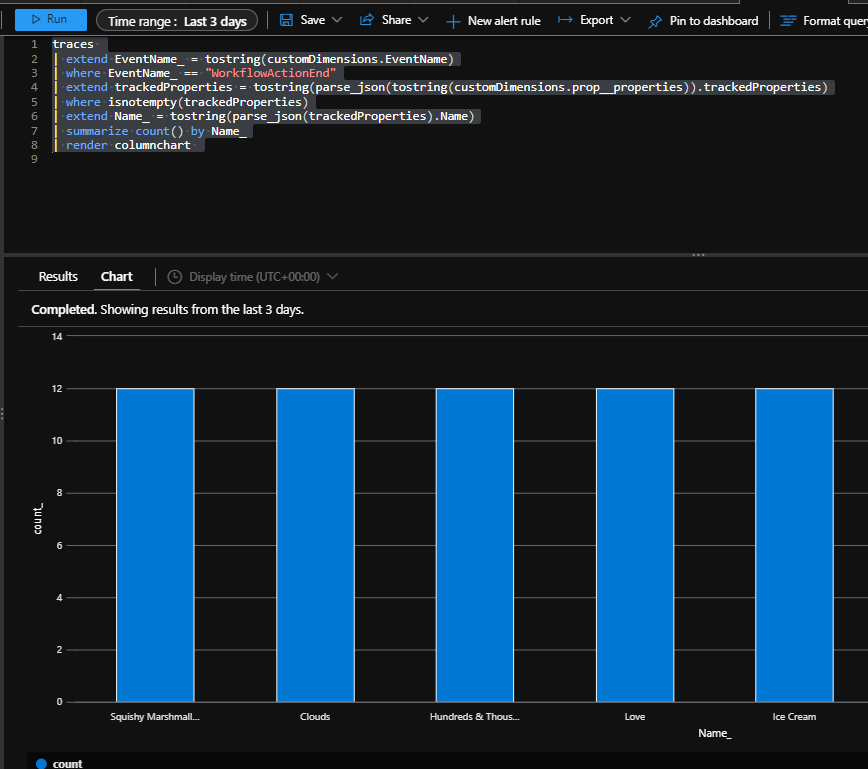
Graphs using my tracked properties
If I have a view with my tracked properties in it then I can great some visuals with kusto to show charts of whats happening in my logic apps.
The below query will show a chart showing how many of each type of product ive processed in the time period.
traces
| extend EventName_ = tostring(customDimensions.EventName)
| where EventName_ == "WorkflowActionEnd"
| extend trackedProperties = tostring(parse_json(tostring(customDimensions.prop__properties)).trackedProperties)
| where isnotempty(trackedProperties)
| extend Name_ = tostring(parse_json(trackedProperties).Name)
| summarize count() by Name_
| render columnchart
Note ive only got a couple of workflows in here, in the real world your queries proably need to filter down to make sure your pulling in just the ones you want to this view. I could just look for ones with tracked properties in for the demo.
Now is this getting really useful!
Workbook
We now know how to do some deep dives on querying the logs so we can take advantage of the workbooks feature in app insights to do some more user friendly ways to easily see this data. Lets take a look at a few ive done.
To start with, in the App Insights workbooks section you can use workbooks which come out of the box or make your own. Id expect that eventually Microsoft will make some Logic App workbooks which will help people but since there arent any yet Ive put together a couple to show what can be done. Note that the workbooks will also show in your resource group as items.
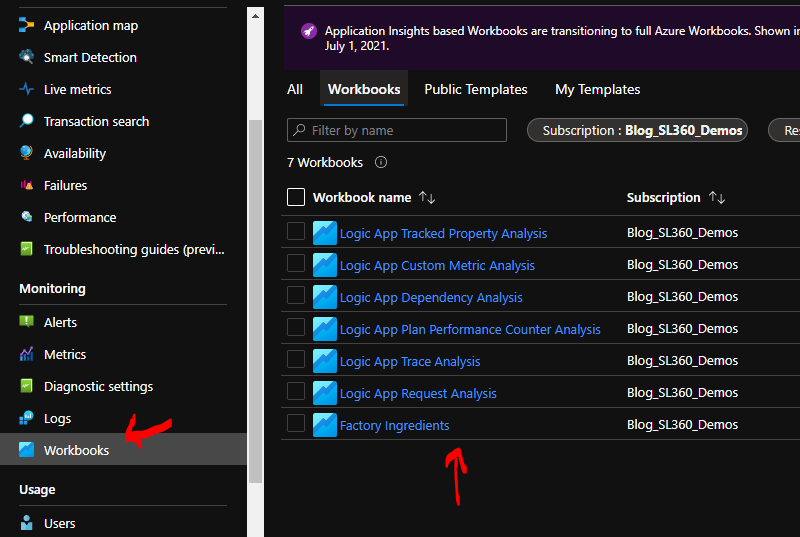
My workbooks fall into 2 areas. First I have generic ones which are looking at Logic Apps and workflows from a generic perspective and the 2nd type are specific to scenarios implemented by my workflows. Ill show a little about each kind of workbook I created.
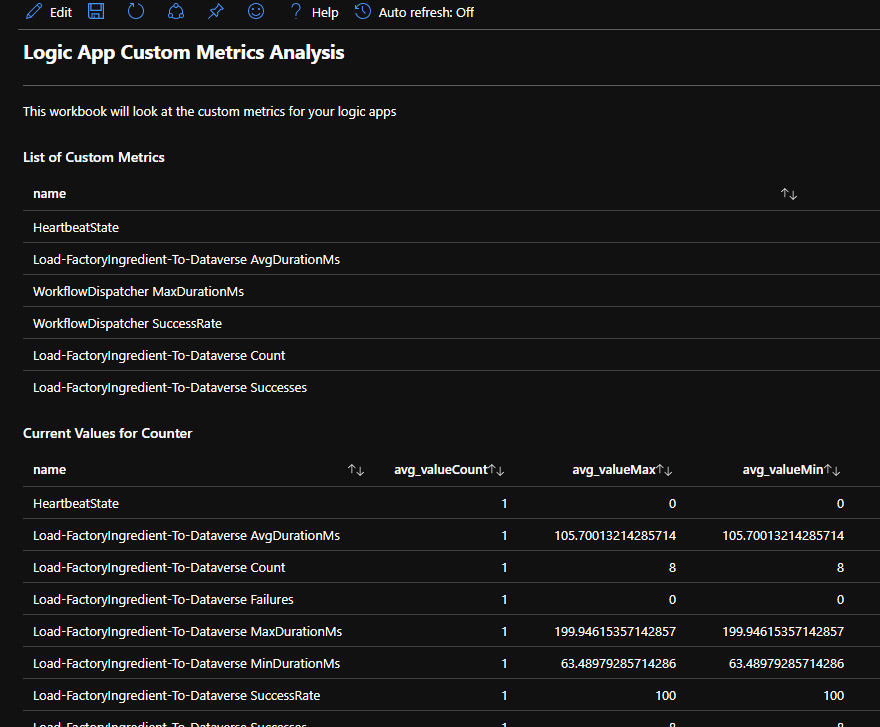
Logic App Custom Metric Analysis
Using the custom metrics queries from earlier I can make a workbook which will give me a simple view of metrics available and the recent values for each one.
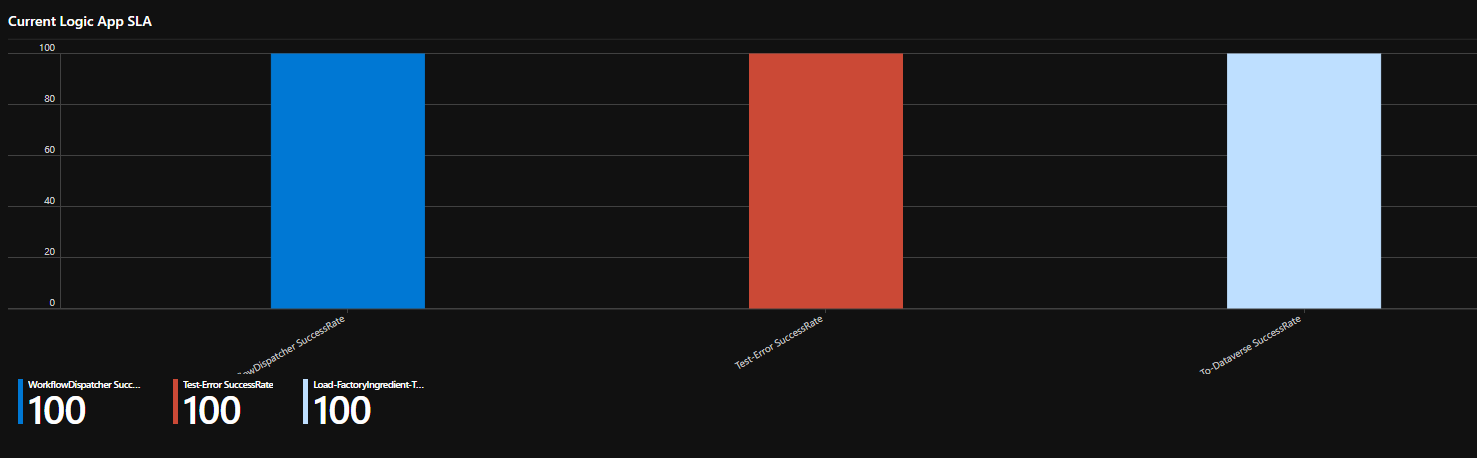
I can create an SLA graph for my workflows
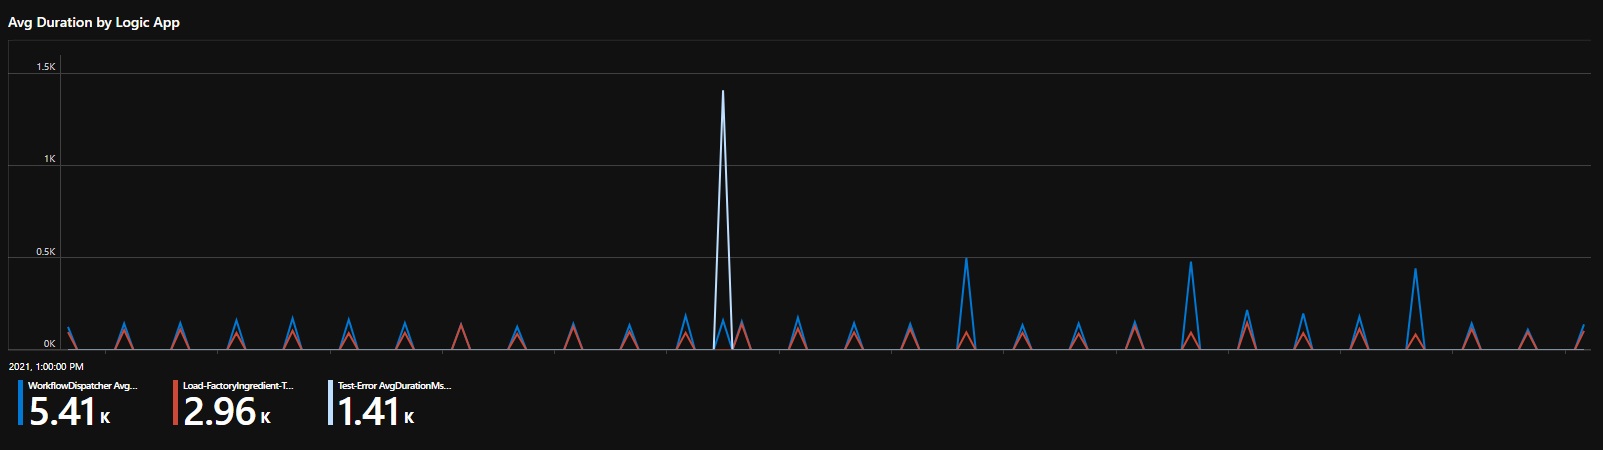
And profile the average duration across my workflows
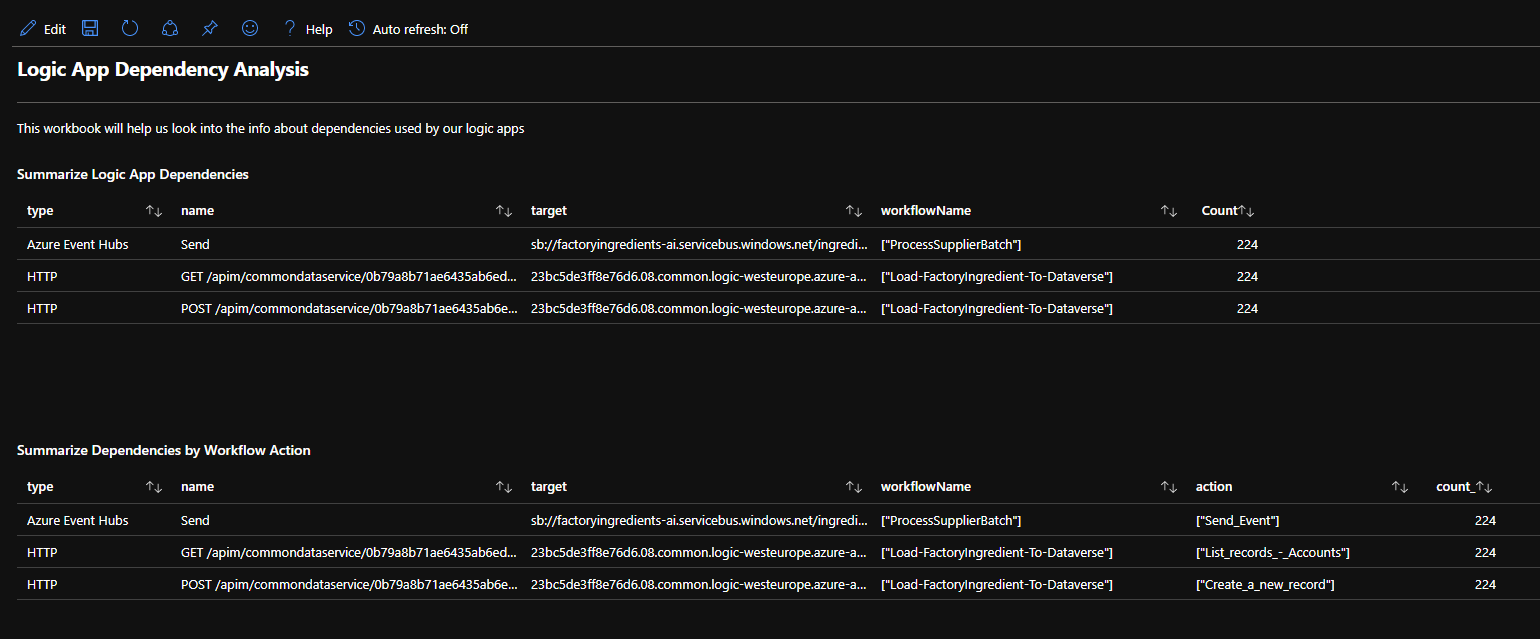
Logic App Dependancy Analysis
In the dependency analysls I have used the queries from earlier to create a workbook to help me see what services are being used by my Logic Apps.
You can see some summaries of which workflows and actions use which service.
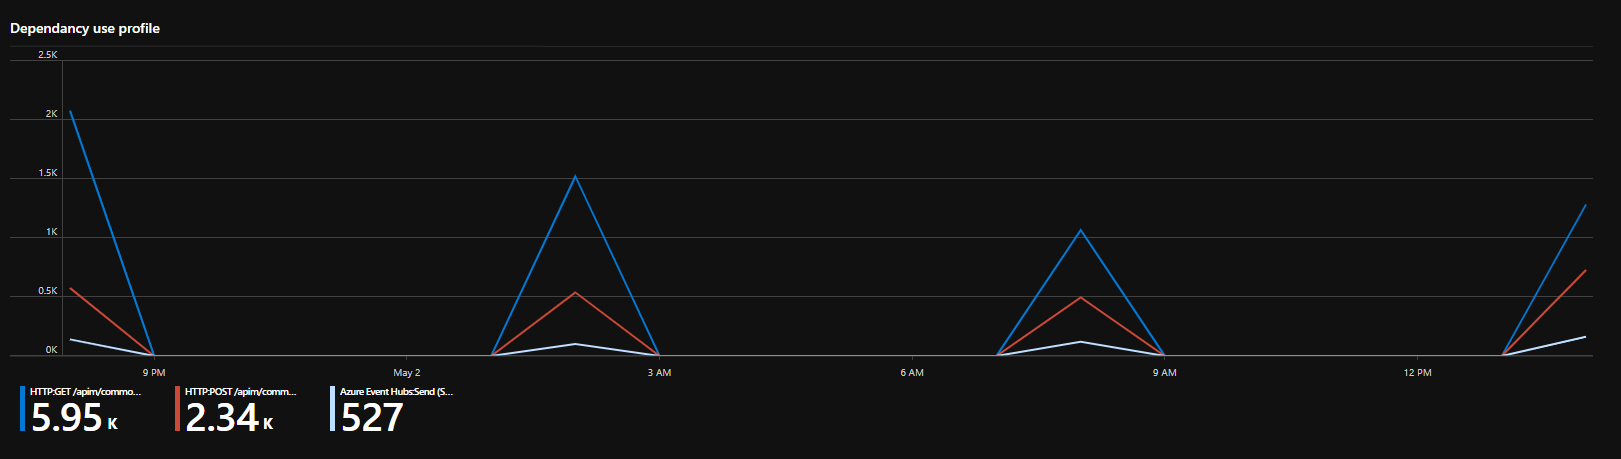
I can also see how much dependancies get used and what their performance is like across workflows
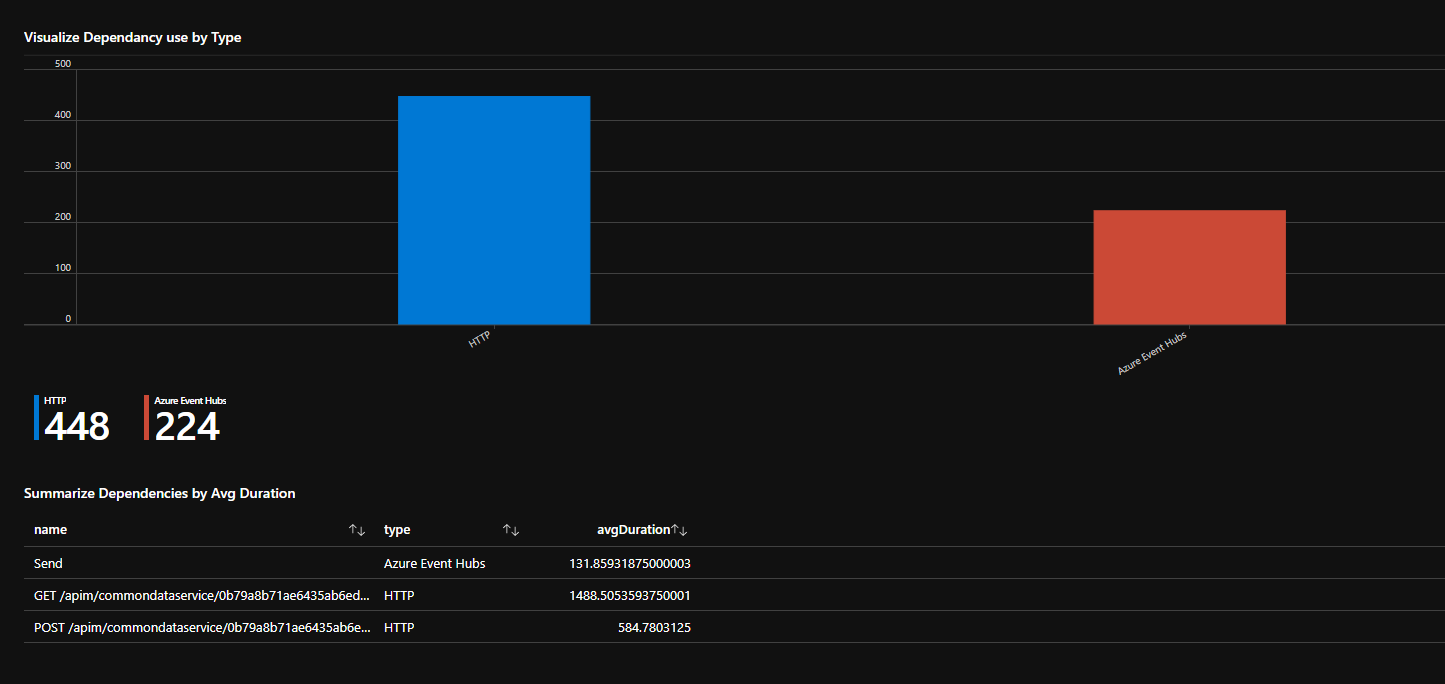
I can profile when the performance of dependencies over time.
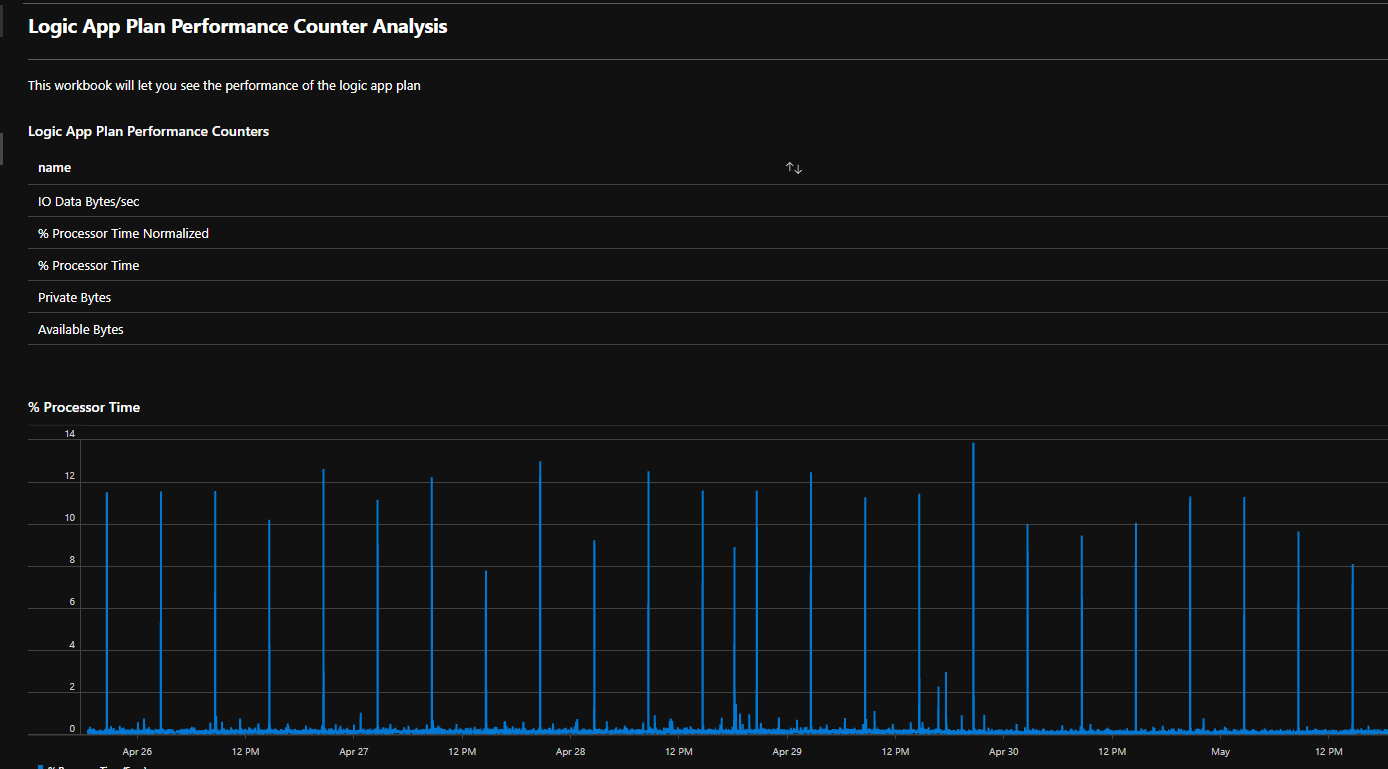
Logic App Plan Performance Counter Analysis
In this workbook I used the queries we looked at earlier to build a set of graphs that will show me whats happening on my hosting plan. Below you can see the list of counters collected and also the CPU graph.
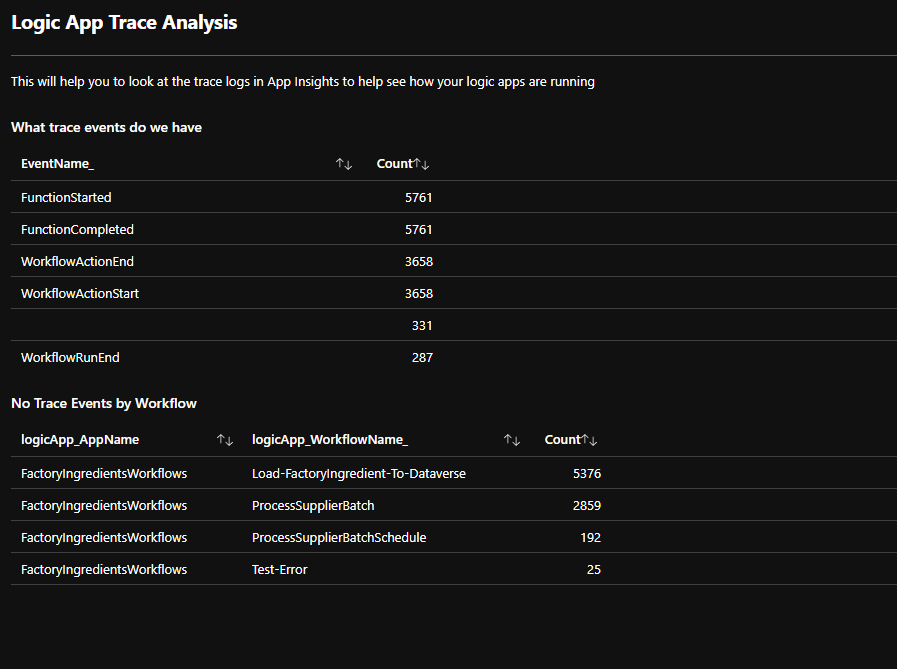
Logic App Trace Analysis
In my trace analysis workbook I have created a view of the trace events getting logged and how many related to each workflow.
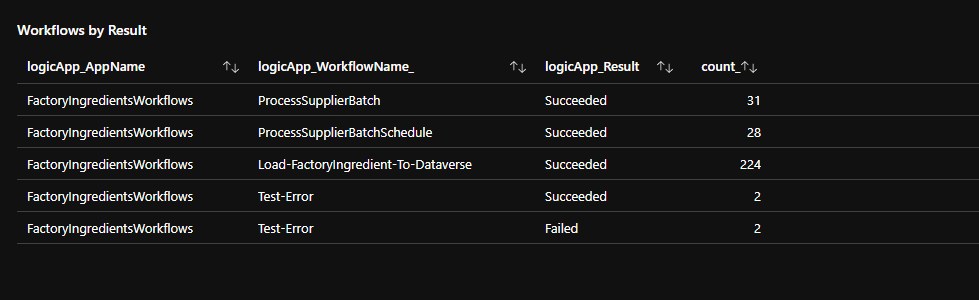
I can see the breakdown for each workflow by result
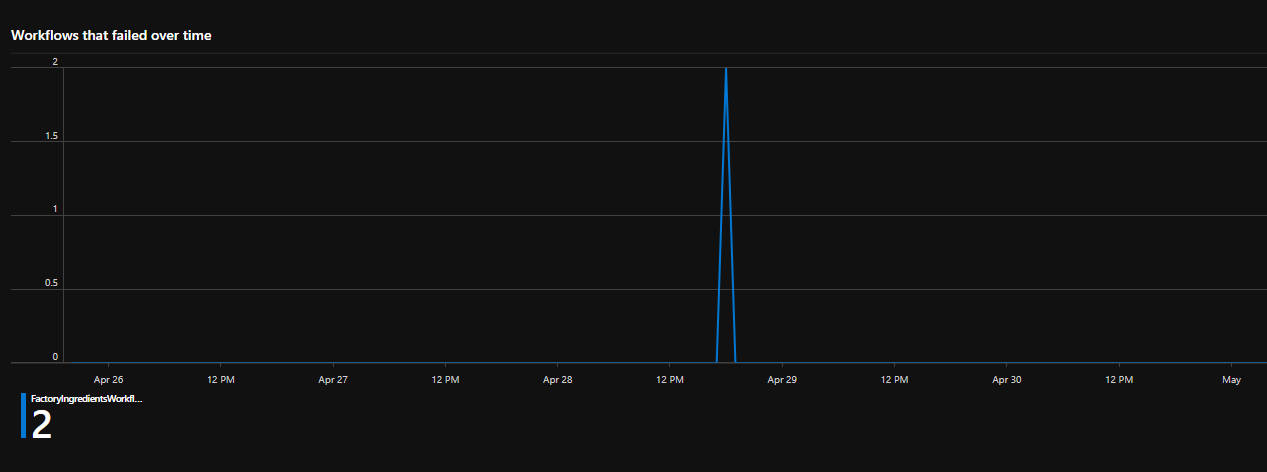
I can graph the timeline of where my workflow failures occurred
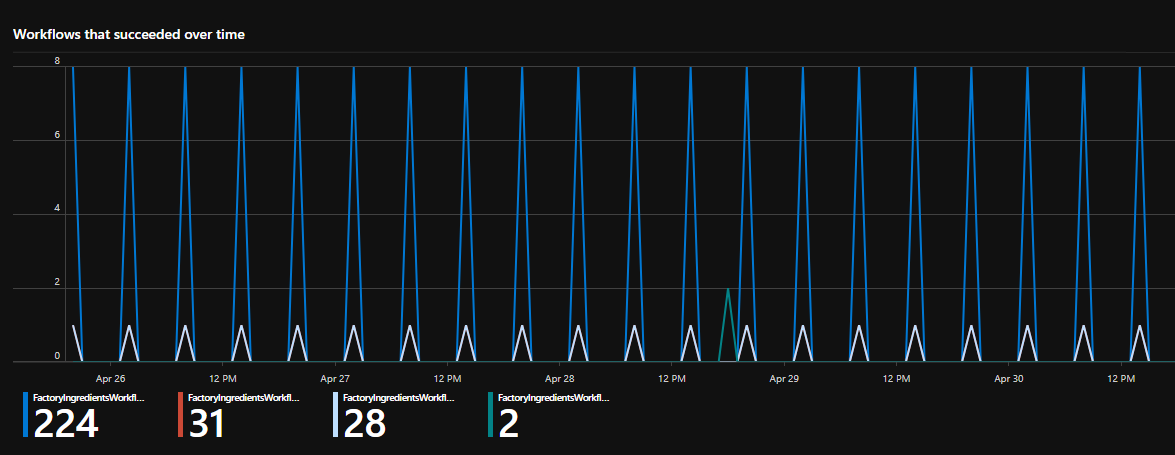
And where they succeeded

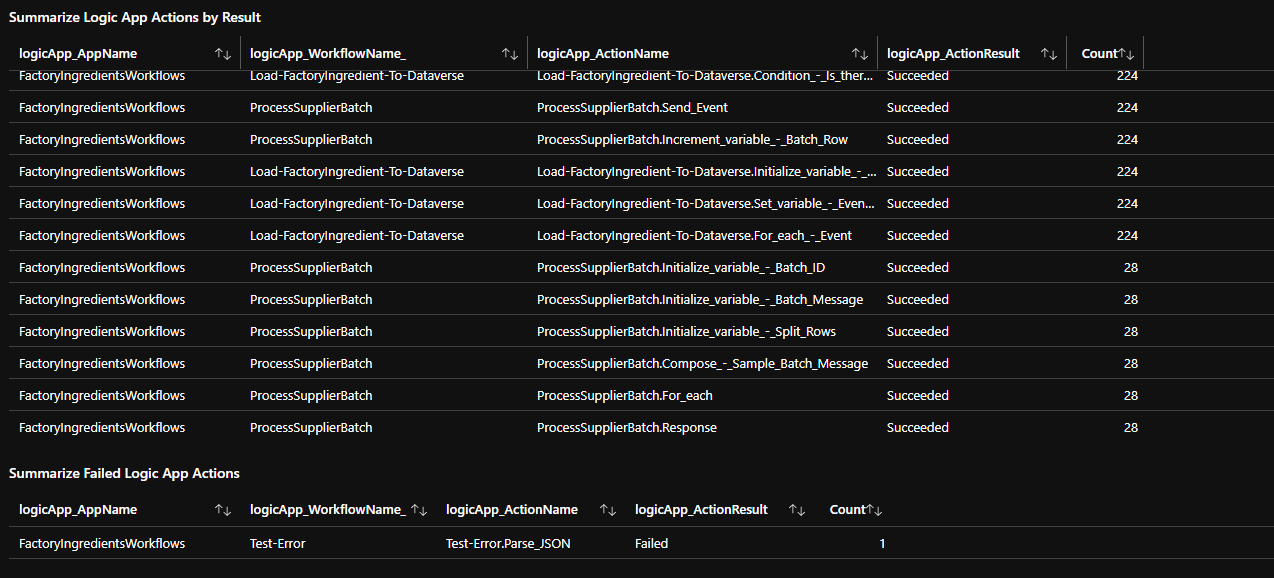
I can also investigate the actions and their results.
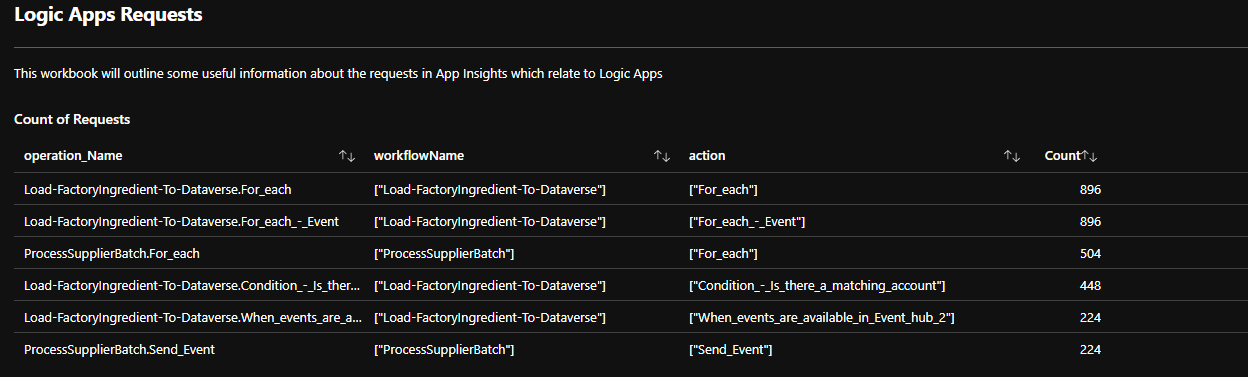
Logic App Request Analysis
The Logic Apps Requests workbook uses the queries from earlier and we can see things like how many occurrences of each action.
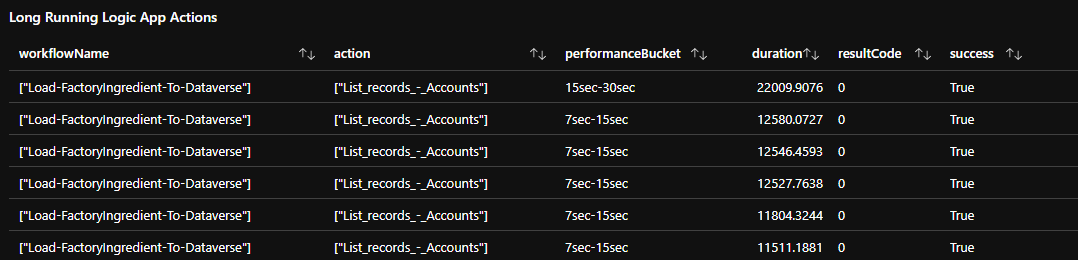
We can list the long running actions
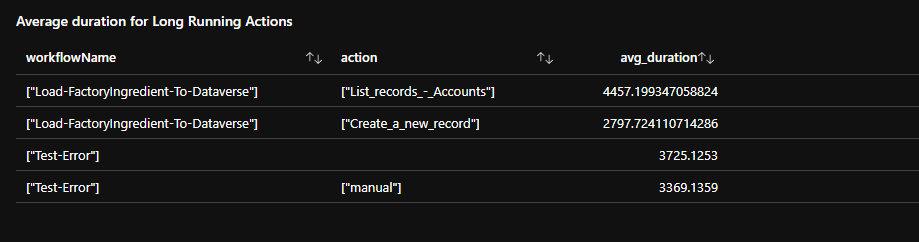
We can look at the avg duration for long running actions
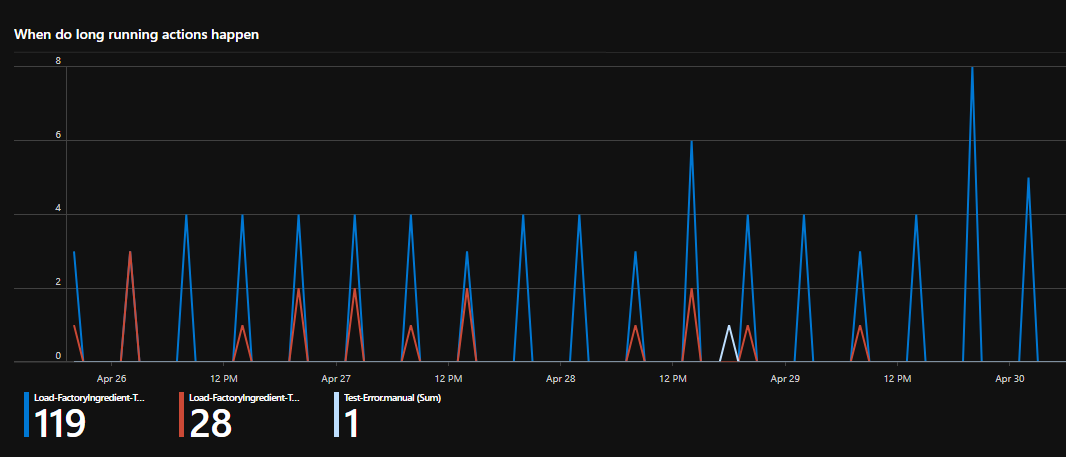
We can profile when these long running actions occur
Factory Ingredients
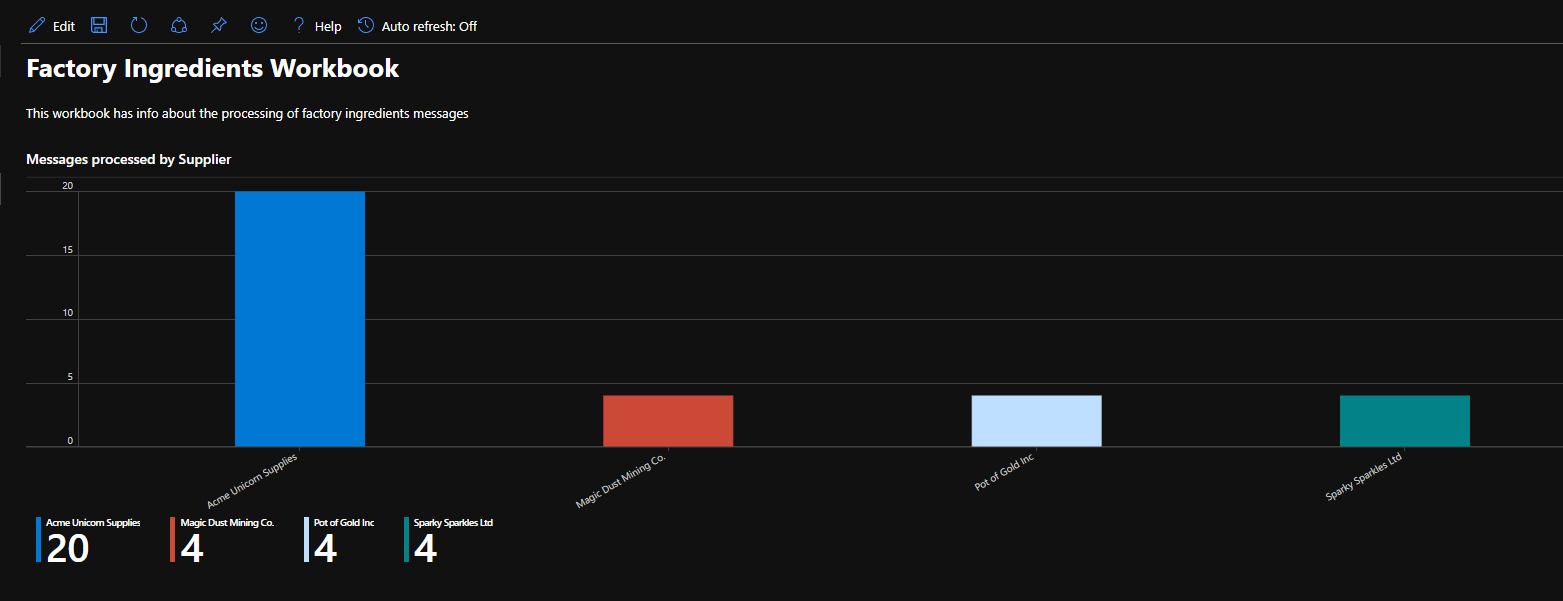
In my factory ingredients workbook I am using some of the queries from earlier to produce a workbook focused solely on the factory ingredients interfaces I have built and to give you metrics and views on how that interface is working.
First off you can see a view of what we have recieved from each supplier.
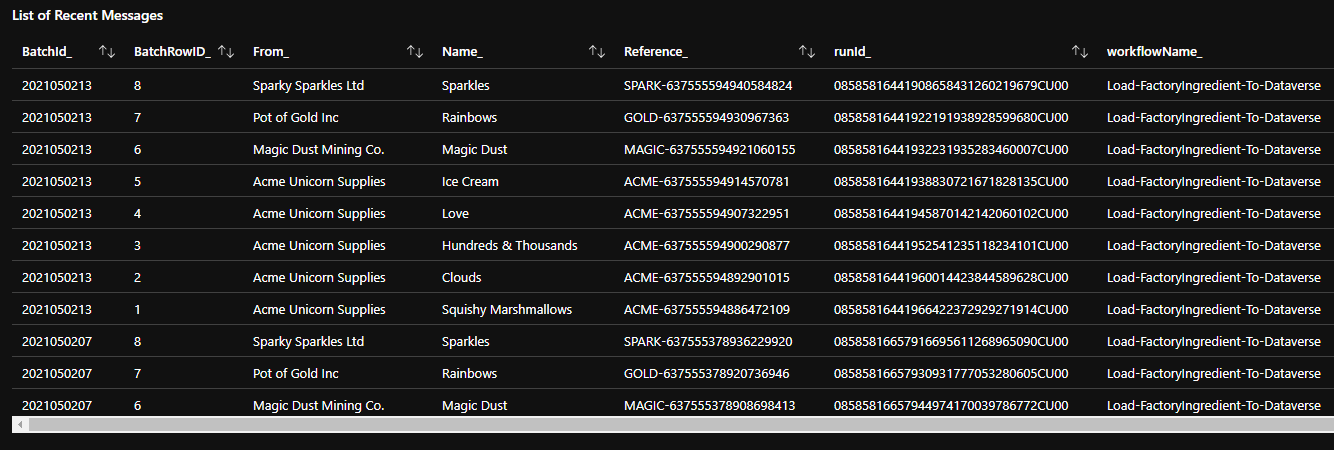
Next ive created a list of my recently processed messages
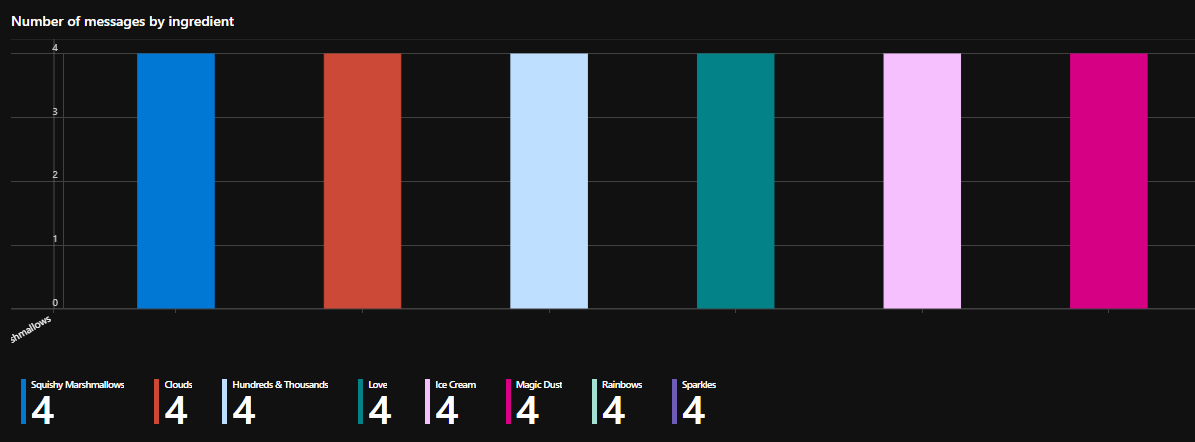
I can also see how many messages were for each type of ingredient.
You can see how just using the tracked properties I am able to create some very rich views of whats happening in my Logic App solution.
Evaluation
I really love what App Insights brings to Logic Apps. As Logic Apps hosted on AKS and App Service opens up so many more enterprise scenarios for Logic Apps the deep analysis of your platform that App Insights offers is now a big bonus for Logic Apps.
Strengths
There are so many strengths here, hopefully ive given a good account of them above.
The biggest strength is that most of what I have shown above you get for almost no implementation overhead. Adding the tracked properties and setting up App Insights was all I did.
I think there are also other good features in app insights which I havent touched on which I am not sure if they will really apply to Logic App implementations yet so there may be more strengths.
Considerations
While App Insights is awesome there are a couple of weaknesses and things to be cautious of.
Application Map
I think the application map could be a really good feature but it seems constrained by not being able to drill into whats happening in the API Hub. Im not sure ill use that feature that much as it is but maybe this is an area microsoft will enhance.
Cloud Only
There is no on premise or self hosted equivelent to App Insights. This may be a constraint for those people who want to implement on premise Logic Apps which is one of the key drivers for the new release of Logic Apps offering self hosting.
Query Language
Kusto has a bit of a learning curve but once you get used to it, its pretty easy to use and because its common to Azure Data Explorer and Log Analytics there are loads of resources out there to help you. For integration people who are new to App Insights, stick with it and you will find kusto useful for lots of the different types of work you do with Azure. For those doing other workloads in Azure and moving to Logic Apps you will find it useful that its using a feature you may already be aware of.
Cost
Possibly the biggest think to be aware of like with Log Analytics is the potential cost of App Insights. It could range from next to nothing to a big number depending on how much you use it. Remember Logic Apps is logging start and end events for everything and there are also runtime events.
Id suggest to keep an eye on your app insights spending when running your logic apps and maybe use the data cap features to keep it to a level your happy with.
I think App Insights is set at the plan level so its either on or off for all of your workflows.
Sampling
App Insights has sampling features. This is used to control costs and handling load scenarios. I am not sure how Logic Apps is configured to handle this but I would just keep this in mind for high load scenarios and hopefully as more info comes out about Logic Apps and App Insights you might find this will be clarified how this works.
I think one key thing to consider if your a BizTalk customer migrating to Azure is that your BizTalk tracking was transactionally consistent with your processing of messages. This is unlikley to be guaranteed in App Insights.
Gaps
There are also a few gaps in the current offering. Id like to be able to write custom events to app insights like we did in one of the other parts of this series of articles where I do a custom log entry to Log Analytics. There is a custom log in App Insights and if I could access that via an action in the workflow to do a custom event then that would be very powerful.
Was this article helpful?