Log Analytics Data Collector API with Logic Apps
- 25 Feb 2022
- 6 Minutes to read
- Contributors


- Print
- DarkLight
- Download PDF
Log Analytics Data Collector API with Logic Apps
- Updated on 25 Feb 2022
- 6 Minutes to read
- Contributors
- Print
- DarkLight
- Download PDF
Article summary
Did you find this summary helpful?
Thank you for your feedback!
In this section we will look at using the log analytics data collector API. In the out of the box solution discussed previously we talked about how the logic apps diagnostics settings can help you to push telemetry data to a log analytics workspace and you end up with a semi structured log file with a mountain of information from your logic apps.
An alternative way to use log analytics is that you can use the Data Collector API. The data collector API is a way you can send a message to a custom log in your log analytics workspace.
A custom log will allow you to move from a semi-structured log which the logic apps telemetry gives you to a log which you have control of the structure. You can then make the information in the log file more sensible to your interfaces which you are building. This makes the data a lot easier to parse and you will also get rid of all of the noise in the out of the box log and will only write the events when you choose to.
The other good thing is there is also an out of the box connector for Logic Apps which allows you to specify the workspace id and key and will handle the writing the message for you.
Target Users
I believe these are the user types that would be using the logs from this approach
- IT Support Operators
Target Use Cases
These are the high level use cases your support operator would be doing that would benefit from this approach.
- Interface specific logs and workbooks
- Troubleshooting issues with your implementation
- Getting a view of logs across your different Logic Apps
Prerequisites
- A log analytics workspace
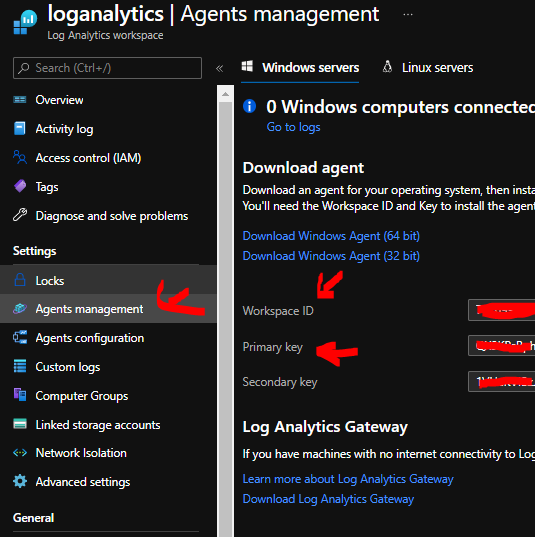
- The log analytics workspace id and key which are shown in the pic below
Writing to the Log from your Logic App
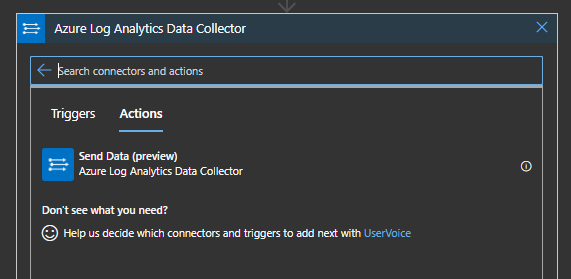
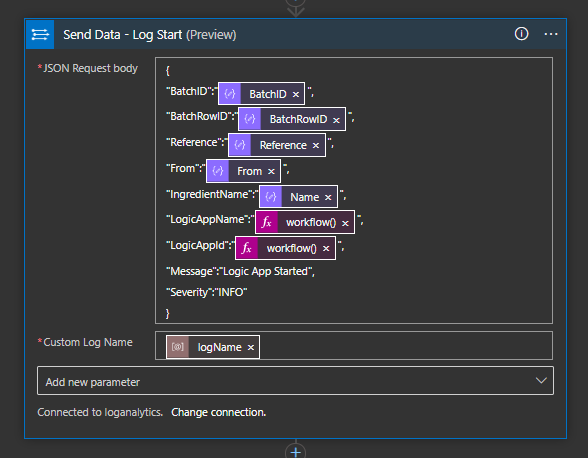
In any logic app you can now add the action for the Log Analytics Send Data connector.
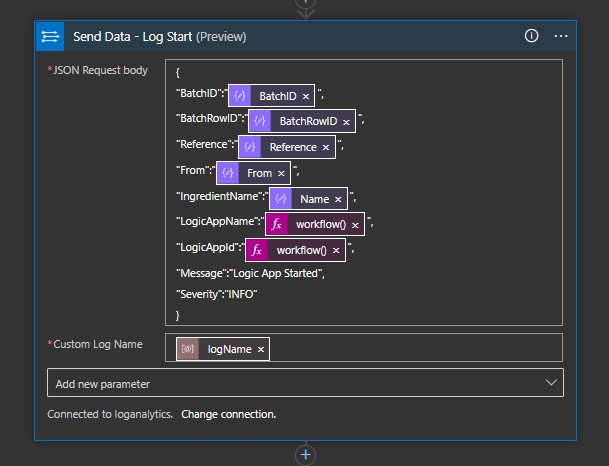
When setting it up you will provide the workspace id and key and logic apps will create an API Connection like with most connectors. You then need to tell the connector the name of the log to write to and provide a json object as shown below.
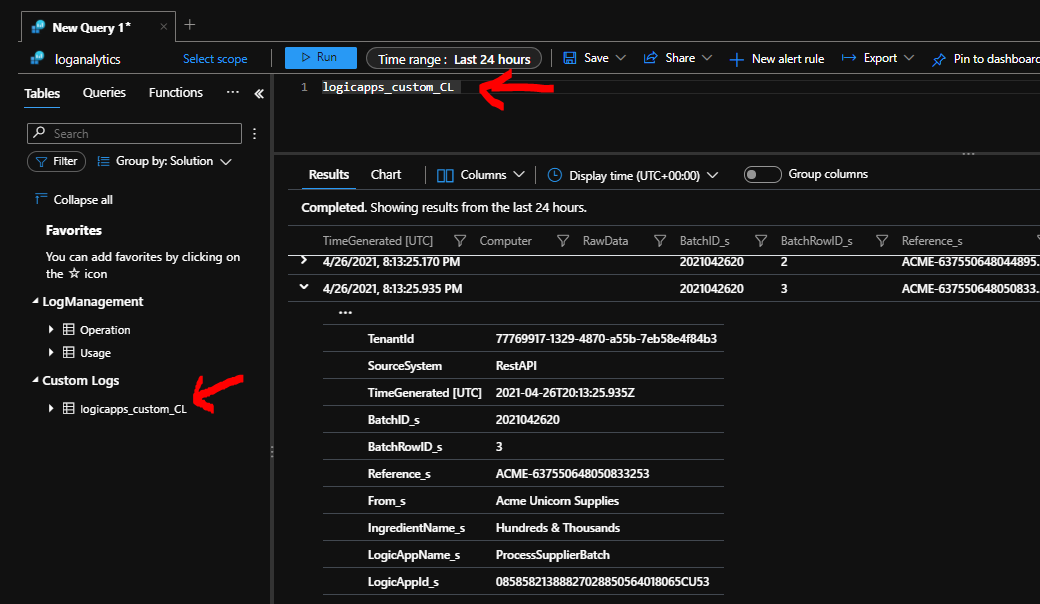
At runtime this will then call the connector and write a message to a log in your workspace which you can then query. You can see below a basic query of the log data I have written.
Considerations
There are a few things to be aware of:
- 1 logic app can write to multiple different logs
- Multiple logic apps can write to the same log
- How should I structure my logs (how many logs)
- There are some constraints on the logs eg number of columns etc. They are listed in the article I linked to above so please have a read of that article it will help you be aware of them
- The calls to the log are explicit and happen when you want them too and you supply the data you want written to the log
How many logs should I create
Typically I might have a generic log for basic logic app info I want to write and sometimes I will have a specific log for certain scenarios which is shared by a sub-set of my logic apps.
Querying my data
The key benefit of the custom log is you have a data structure which is easier to work with from the view of querying and using the data.
Which batches have I received
In my logic app in the demo I want to query for all of the times I have received batches. I an writing to the custom log each time I process a batch and I can easily query it like below:
logicapps_custom_CL
| where LogicAppName_s startswith "ProcessSupplierBatch" and Message contains "Logic App Started"
| project LogicAppName_s, LogicAppId_s, BatchID_s, Message, TimeGenerated
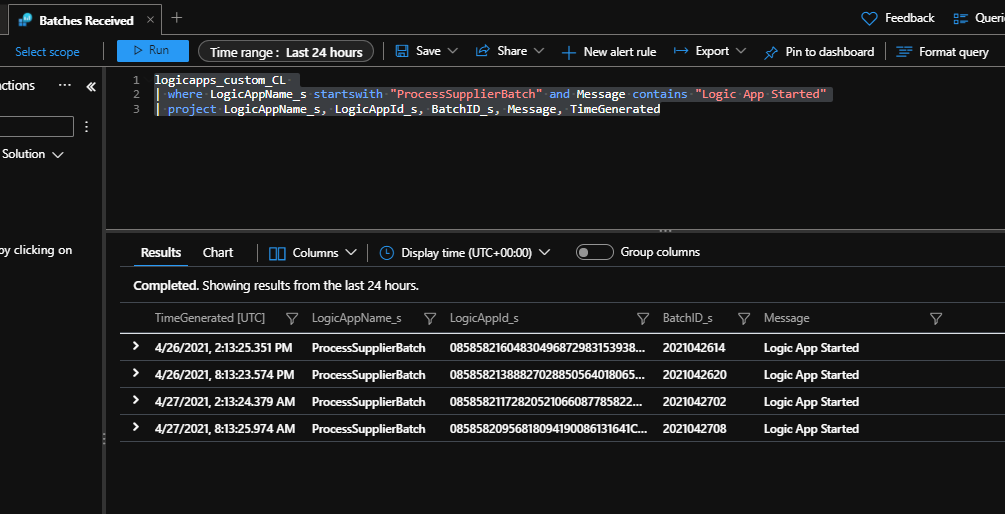
You can see I get an easy to use list of the batches, what the batch id was and which logic app processed that batch.
Which messages were from a certain supplier
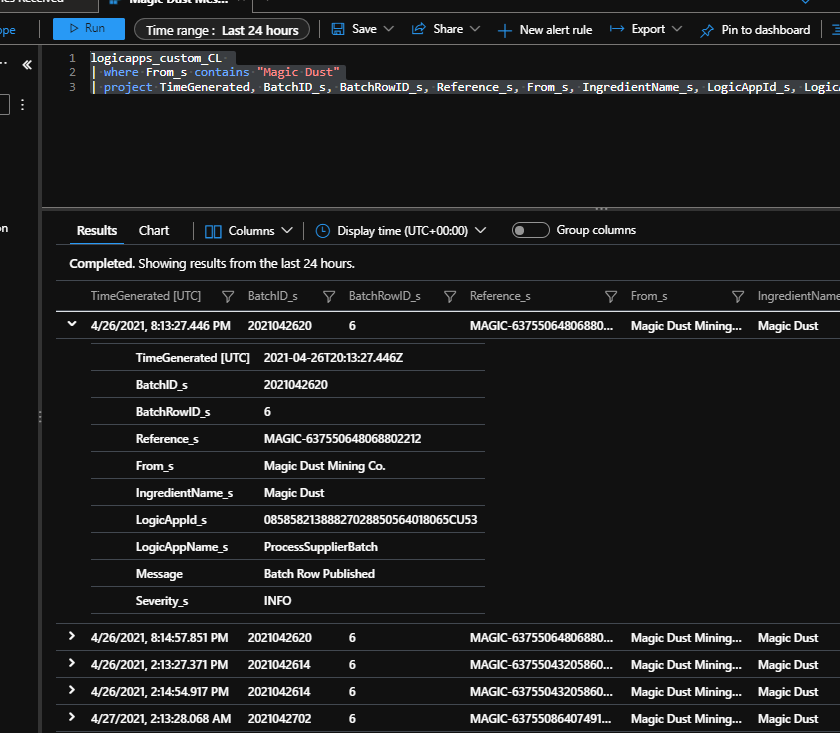
When I debatch the inbound batch and load it to the event hub for the dataverse loader logic app to process the message, I might be need to find which logic app processed a given message. In this case I can add the send data action to the logic app and record a log entry for each message we process like shown below.
I can now use the below query which will allow me to search for all messages which were processed which came from my supplier called Magic Dust company.
logicapps_custom_CL
| where From_s contains "Magic Dust"
| project TimeGenerated, BatchID_s, BatchRowID_s, Reference_s, From_s, IngredientName_s, LogicAppId_s, LogicAppName_s, Message, Severity_s
The result shown below makes it easy for me to see what was processed and then get to the logic app which processed the message if I need to investigate any issues.
I can also modify this query to provide other ways to help me manage day to day operations of my logic apps.
Workbooks
In addition to the simple operations queries, I can also use the workbooks feature to help me create useful views of the data in my logs. Below you can see a simple view of some graphs I have created in a workbook based on the ingredient processing logs.
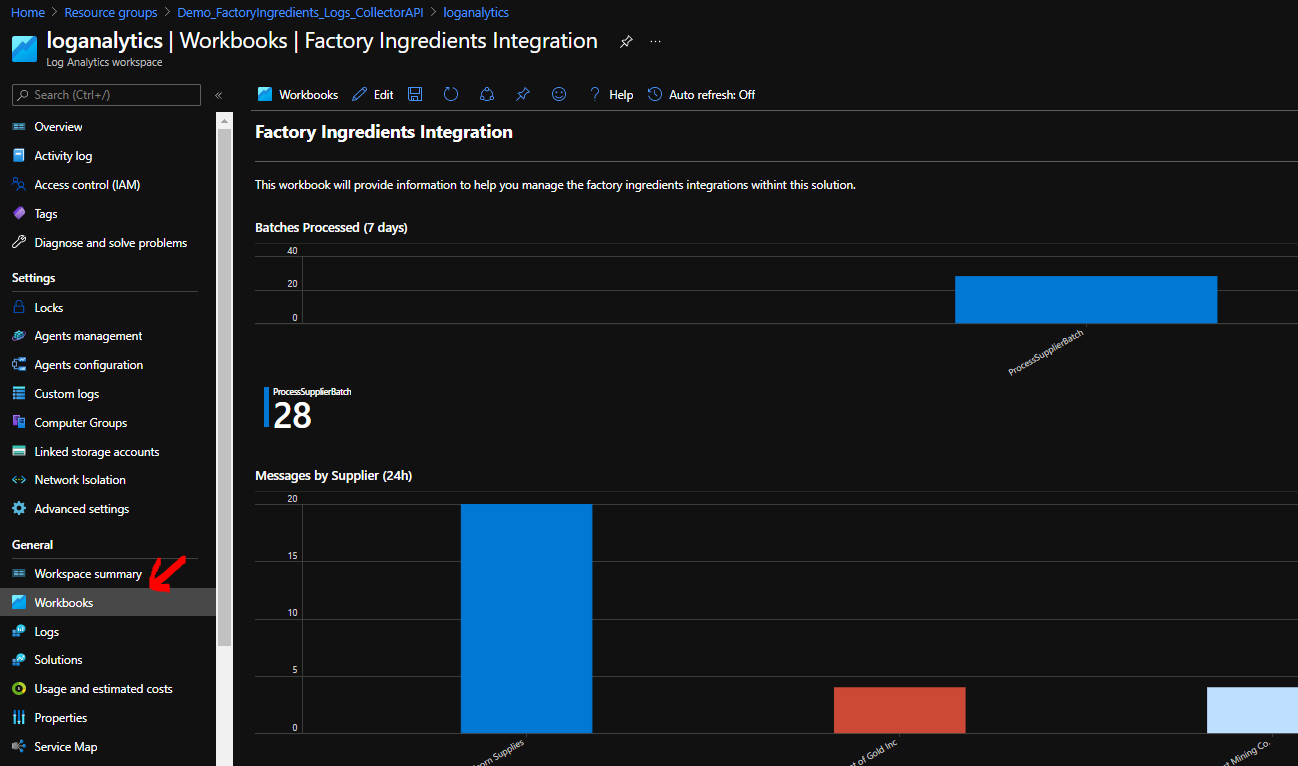
If we breakdown the workbook and look at a few of the sections in it you can see how its made up.
Batches Processed in last 7 days graph
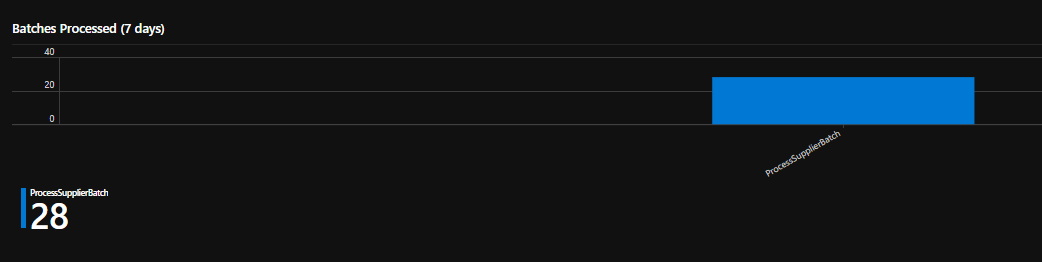
logicapps_custom_CL
| where LogicAppName_s startswith "ProcessSupplierBatch" and Message contains "Logic App Started"
| summarize Count=count() by LogicAppName_s
| render barchart
Messages by supplier in last 24 hours
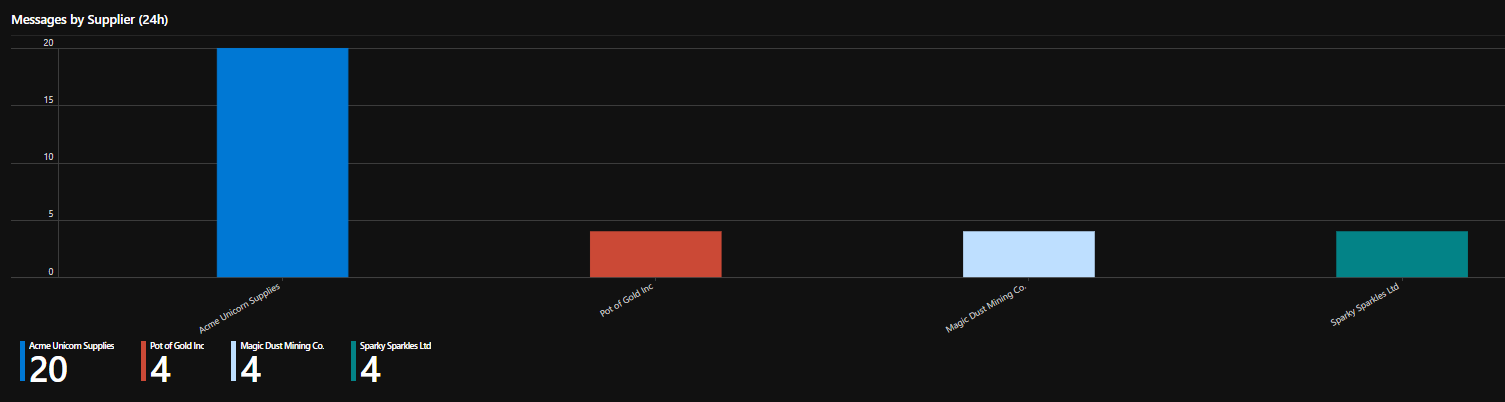
logicapps_custom_CL
| where LogicAppName_s startswith "Load-FactoryIngredient-To-Dataverse" and Message contains "Logic App Started"
| summarize Count=count() by From_s
| render barchart
Recent batches processed list
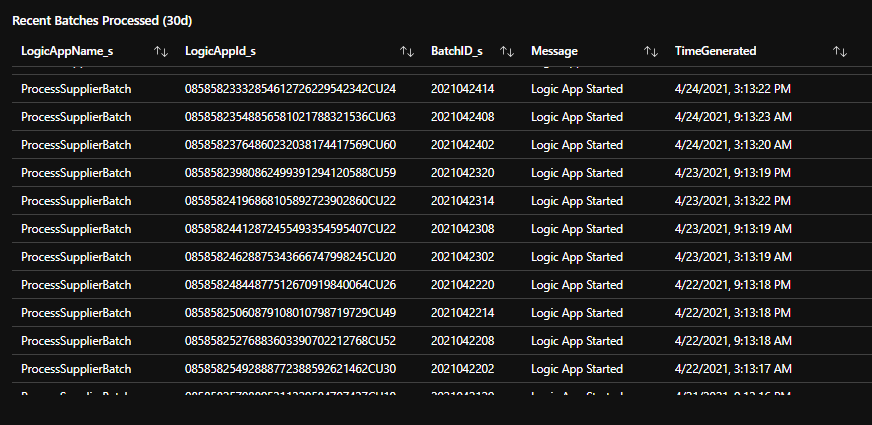
logicapps_custom_CL
| where LogicAppName_s startswith "ProcessSupplierBatch" and Message contains "Logic App Started"
| project LogicAppName_s, LogicAppId_s, BatchID_s, Message, TimeGenerated
| order by TimeGenerated desc
Recent messages processed list
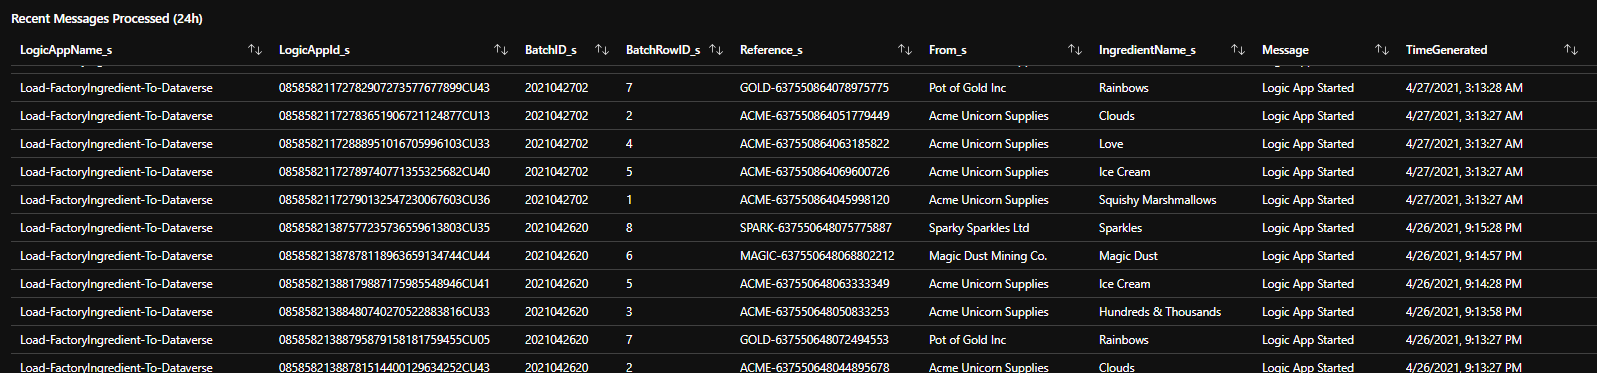
logicapps_custom_CL
| where LogicAppName_s startswith "Load-FactoryIngredient-To-Dataverse" and Message contains "Logic App Started"
| project LogicAppName_s, LogicAppId_s, BatchID_s, BatchRowID_s, Reference_s, From_s, IngredientName_s, Message, TimeGenerated
| order by TimeGenerated desc
With the workbook you can see its very easy to use my structured log to create a very easy to consume view of what is happening in my interface.
Evaluation
The custom log approach combining Logic Apps and Log Analytics is really about creating a log file that doesnt require you to be a logic apps expert to be able to mine and use.
You will find that your integration team and support operators will be able to use the data produced in your custom log as a way to quickly find the logic apps they need to troubleshoot issues.
While you will need to be competent with a number of Azure skills to use the data it is not as difficult as consuming the less structured logs from the out of the box diagnostics data.
Strengths
- The connector is easy to use
- Its simple to send the log data to log analytics
- You have control over what you want to log
- Its much easier to query the data and create useful visualisations with it
- A lot less data will be logged
Considerations
- Data Collector API is still in preview as per date of writing
- There is a call from your logic app to send the data. There are approaches to handle this if you have a concern about overhead but it is pretty minimal as connectors go
Where do I use what
In the real world what I tend to do is as follows:
- I have used this approach on a couple of projects and I really like it, it makes it easy to support your interfaces and you can log information you want logged
Explore more on Tracking Message Properties
Was this article helpful?