Log Analytics Out of the Box with Logic Apps
- 31 May 2021
- 8 Minutes to read
- Contributors

- Print
- DarkLight
- Download PDF
Log Analytics Out of the Box with Logic Apps
- Updated on 31 May 2021
- 8 Minutes to read
- Contributors
- Print
- DarkLight
- Download PDF
Article summary
Did you find this summary helpful?
Thank you for your feedback!
In this section I will take a look at the out of the box capability for Logic Apps with Log Analytics. This is where you can turn on the diagnostics settings in a logic app and it will push information to a log analytics workspace from the workflow runtime and metrics.
From the perspective of this article we are looking at the information that gets put into the AzureDiagnostics log in the log analytics workspace. This results in a semi-structured log file which you can use to help look at whats happening in your logic apps and which Microsoft have provided a logic apps solution for the Log Analytics workspace to help you use some of the data.
Target Users
The Logic Analytics out of the box capabilities with the Logic Apps Management Solution are aimed at Logic App specialists who have a good understanding of the logic apps and how they work and can query the log data to interpret meaningful views on the data from deep analysis of the logs.
Target Use Cases
Some of the places you might be likely to use this are:
- Analysis of performance issues
- Querying the logs across different logic app runs so you can see patterns in behaviour across different runs
- Getting a holistic view of logic apps behaviour and performance
Prerequsites
- You will need a log analytics workspace
- You will need to add the logic apps solution for log analytics to your workspace
Enabling the Feature in Logic Apps
There are a couple of different ways you can enable the feature, it doesnt need any changes to the workflow in your logic app, you just turn on the diagnostics settings for the workflow.
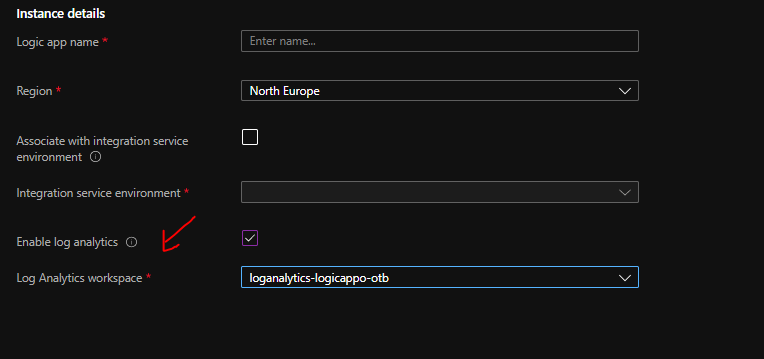
Add to a new logic app
When you create a logic app via the portal you can choose the enable log analytics workspace options as shown below
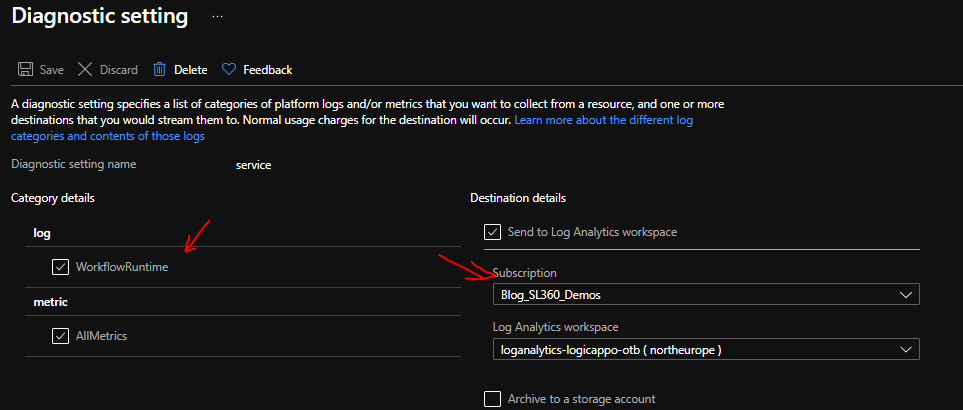
Add to an existing Logic App
In the diagnostics settings of an existing logic app you can turn on the send to log analytics workspace as shown below
Add via ARM deployment
You can set the diagnostics settings for your Logic Apps within the ARM template using the Microsoft.Insights/diagnosticSettings resource. There is more info on that on the below links:
- https://docs.microsoft.com/en-us/azure/azure-monitor/essentials/resource-manager-diagnostic-settings
- http://techstuff.bergstrom.nu/enable-logic-apps-diagnostics/
What do you get for free
When you are using Log Analytics with Logic Apps and have the Logic Apps solution installed then you get a bunch of capabilities out of the box. Some of these include:
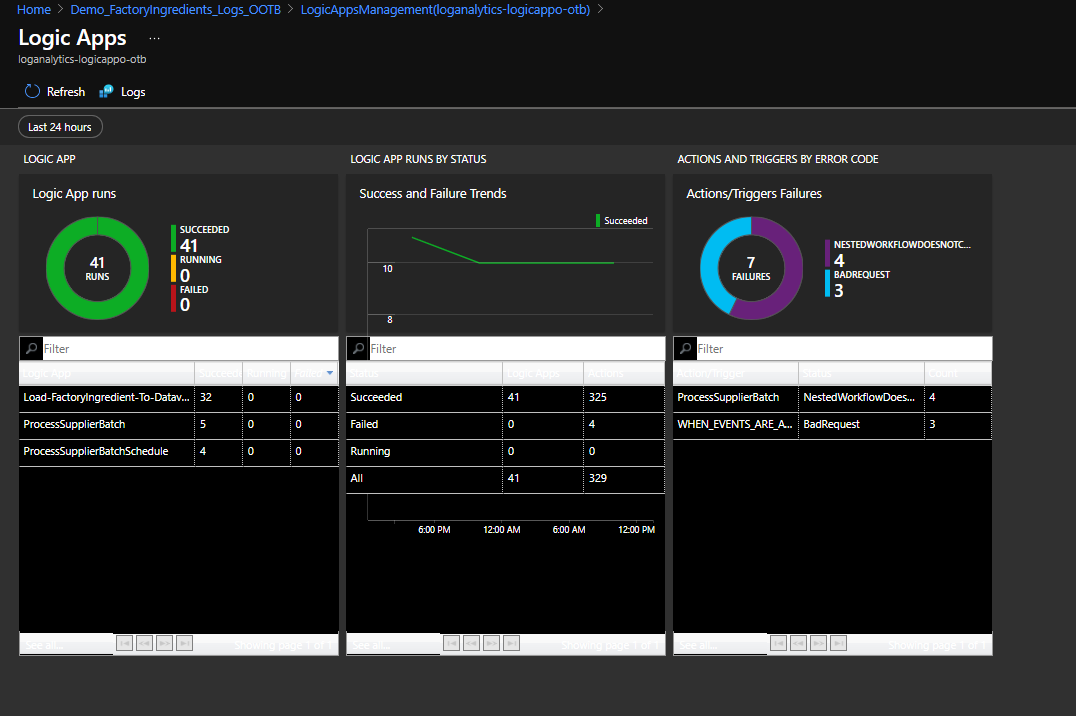
Logic App Solution Dashboard
The logic app solution dashboard gives you a very high level view of your logic apps and their status. If I am totally honest it looks great for demos but I think when you have a real world implementation it is tough to get
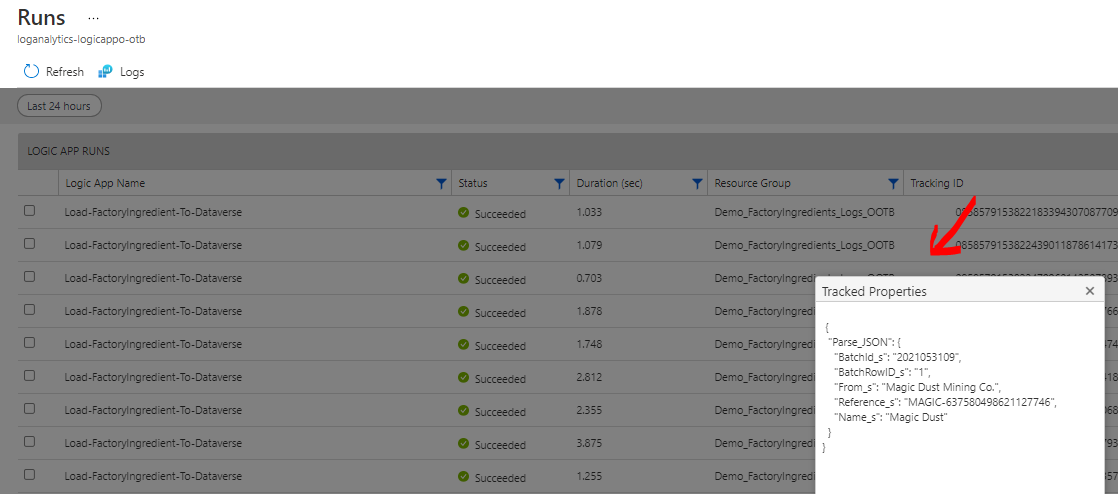
Enhancing the telemetry data with Tracked Properties
In a Logic App you can use the tracked properties feature so that your telemetry event to Log Analytics will also include some meta-data about what is happening.
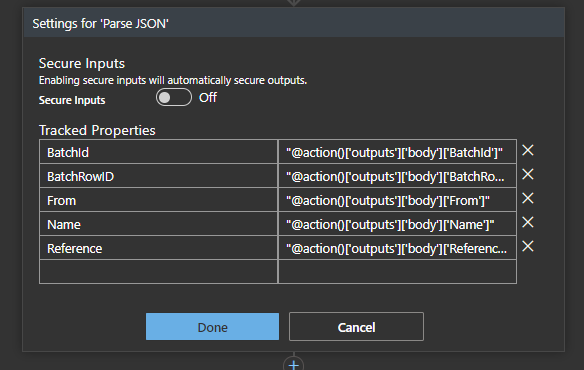
You can then use the Logic App Management Solution to see your Logic App and view the tracked properties.
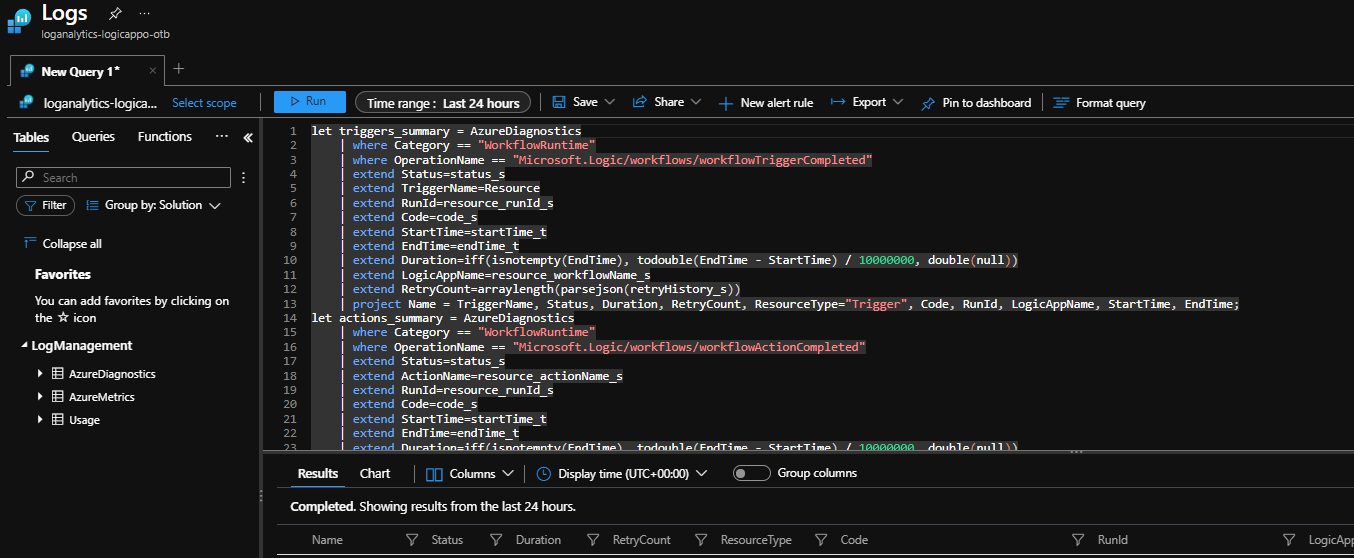
Click through into underlying Log Analytics logs
If you are on the logic app solution looking at a logic app run you can also click on it and it will drop into the log analytics raw logs where the logic app telemetry is writing information into the AzureDiagnostics logs and you can see below in the query it will automatically show you the kusto query to search for the item you chose. You can then choose to modify the query to help you search for other useful views on the telemetry data.
Understanding the Log Data
As I mentioned above the logic apps diagnostics is writing info to the AzureDiagnostics log and you can search for it using the WorkflowRuntime category as shown in the queyr below.
AzureDiagnostics
    | where Category == "WorkflowRuntime"
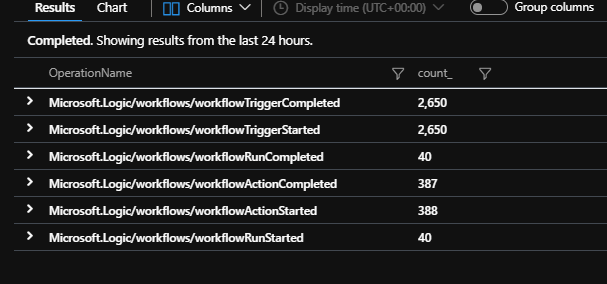
One of the things to remember is that the telemetry data is going to give you a lot of log events for the logic apps. You will get start and complete events for all triggers and actions in addition to the workflow itself. The below query will let you see the different events.
AzureDiagnostics
| where Category == "WorkflowRuntime"
| summarize count() by OperationName
The next thing I could do is use a query like the below which would break down the log entries to summarise by workflow name, action name and event type. This will give me a good view of how many of each different type of event I have recorded like below.
AzureDiagnostics
| where Category == "WorkflowRuntime"
| project Name = strcat(resource_workflowName_s, ":", resource_actionName_s, ":", replace("Microsoft.Logic/workflows/", "", OperationName))
| summarize count() by Name
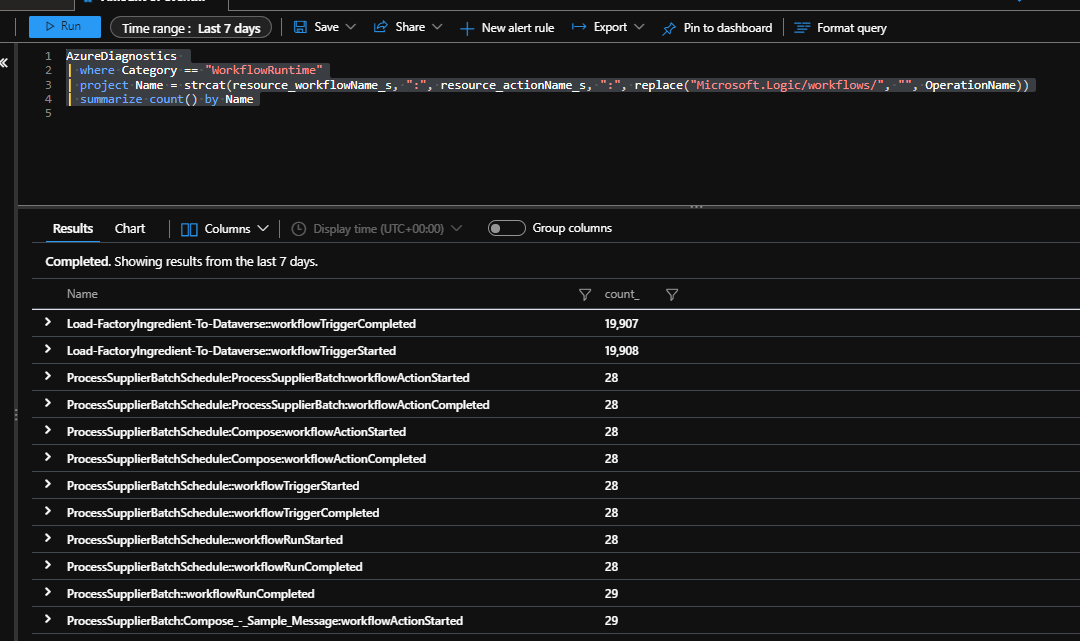
You can see in the image that I have a LOT of events which relate to the trigger and just a few relate to actual runs of the workflow.
Once you see how the log data is structured you can do some pretty awesome queries from Log Analytics to see how your Logic Apps are running.
Some examples are below:
List all Logic App runs by start time
AzureDiagnostics
| where Category == "WorkflowRuntime" and OperationName contains "Microsoft.Logic/workflows/workflowRunStarted"
| project resource_workflowName_s, resource_runId_s, startTime_t, ResourceGroup
| order by startTime_t desc
List the actions that fail across all logic apps
AzureDiagnostics
| where Category == "WorkflowRuntime" and OperationName contains "Microsoft.Logic/workflows/workflowActionCompleted" and status_s contains "Failed"
| project resource_workflowName_s, resource_actionName_s, resource_runId_s, startTime_t, ResourceGroup, error_code_s, error_message_s
| order by startTime_t desc
Graph the most common actions which fail in my Logic Apps
AzureDiagnostics
| where Category == "WorkflowRuntime" and OperationName contains "Microsoft.Logic/workflows/workflowActionCompleted" and status_s contains "Failed"
| summarize count() by strcat(resource_workflowName_s, resource_actionName_s)
| render barchart
Graph the workflows which have errors
AzureDiagnostics
| where Category == "WorkflowRuntime" and OperationName contains "Microsoft.Logic/workflows/workflowRunCompleted" and status_s contains "Failed"
| summarize count() by resource_workflowName_s
| render barchart
Graph the number of runs of different workflows that have ran
AzureDiagnostics
| where Category == "WorkflowRuntime" and OperationName contains "Microsoft.Logic/workflows/workflowRunCompleted"
| summarize count() by resource_workflowName_s
| render barchart
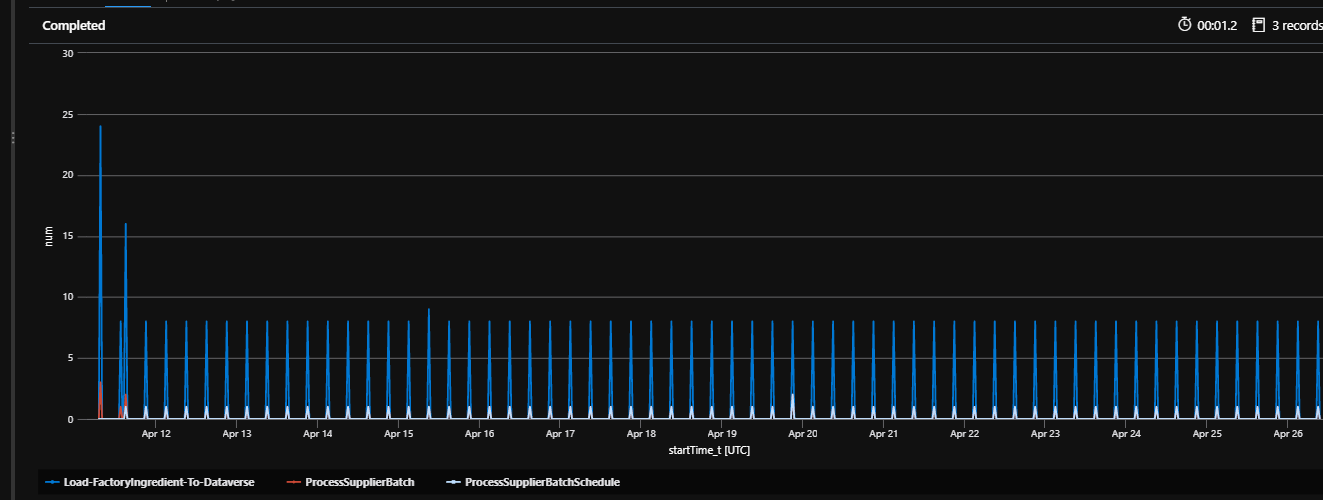
Graph the workflows running per hour
I like this query, you can use it to get a profile of how many logic apps are starting per hour across a time period grouped by the different logic app names.
let min_t = toscalar(AzureDiagnostics | summarize min(startTime_t));
let max_t = toscalar(AzureDiagnostics | summarize max(startTime_t));
AzureDiagnostics
| where Category == "WorkflowRuntime" and OperationName contains "Microsoft.Logic/workflows/workflowRunStarted"
| make-series num=count(), default=0 on startTime_t in range(min_t, max_t, 1h) by resource_workflowName_s
| render timechart
The picture below shows the profile for my demo where you can see its regularly running data.
Evaluation
Hopefully this gives you a good idea of what you can do with the log analytics data when your logic apps have the diagnostics telemetry going to a log analytics workspace.
Strengths
Ease of setup
The biggest strength of the logic app log analytics ingestion is that it is very easy to setup.Per Logic App configuration
Log Analytics telemetry publishing can be configured on a per logic app basis so you can have it enabled for some logic apps on the consumption plan and not on others. This can be very helpful when you want to minimize the amount of noise in your logs
Considerations
Too much data?
The main consideration of the logs are that there is potentially a huge amount of data in them.No cross logic app on/off button
The trade off for the configuration being on a per logic app basis is that if I want to turn it on or off I need to do it on every logic app.Preview
The Logic Apps Management solution in log analytics has been out for a few years and it is still classed as in preview. I think this can be considered a weakness as it will deter people from using it, but its important to remember that the logic apps solution is a view on the log data and is not the same as the bit where the diagnostics telemetry data is pushed to the log analytics workspace.Difficulty in creating useful queries
The data that is captured is tied to your logic app action and trigger events. Its not always that easy to create useful queries from those events.
- Cost
If you are using a lot of logic apps then you need to be aware of the cost impact on log analytics. The pricing for log analytics is:
Data Ingestion = per GB of data per month
Data Retention = per GB of data per month
(more info on pricing is on this page: https://azure.microsoft.com/en-gb/pricing/details/monitor/)
If you consider the demo I have above its only small but id argue that 90+% of the data being sent to log analytics is not useful to me. In my case the logic app usage of my demo is very small but I still have 30,000 events in log analytics in a few days. If my retention period is high and I have a lot going on in my logic apps then this data will build up over time and this will turn into an associated cost increase. Its easy to foget about this but I have seen quite a few times where people have just turned on log analytics for everything (in particular in non logic apps scenarios) then before they realise their log analytics costs are much more than they anticipated.
Where do I use what
In the real world what I tend to do is as follows:
- Im cautious about sending all of my data to log analytics all of the time using the diagnostics tools. I prefer to turn it on when I need it for specific logic apps.
- I tend to use the log analytics data more when I want to create views of information across multiple runs of logic apps or across runs of a few different types of logic apps as I illustrated in a few of the queries above
- I tend to not use the logic apps management solution much, I tend to use it more for helping me to do complex queries of the underlying logs as there are few click throughs where you can go from the visualization into the log query that creates it and then modify as you go
Was this article helpful?